
The 2.6.0 release of Prometheus includes optimisations to reduce the memory taken by indexes and compaction.
There have been some reports that compaction was causing larger memory spikes than was desirable. I dug into this and improved it for Prometheus 2.6.0, so let's see how.
Firstly I wrote a test setup that created some samples for 100k time series, in a way that would require compaction. It would be nice to get the active heap usage at its peak, however we don't know where in the code this peak is to take a profile then. Instead we'll use the total allocations, which should at least point us in the right direction and may also spot places where we can reduce the amount of garbage generated. As before, we can take a profile with:
runtime.GC()
hf, err := os.Create("heap.prof")
if err != nil {
  log.Fatal(err)
}
pprof.WriteHeapProfile(hf)
There's no external indication that compactions have completed, so we'll cheat by sleeping. We're also working with a relatively small amount of data, so setting runtime.MemProfileRate = 256 at the start of the program will track far more allocations than the default of one in every half million and make results more deterministic.
We can now run go tool pprof -alloc_space heap.prof and then look at the main compaction function:
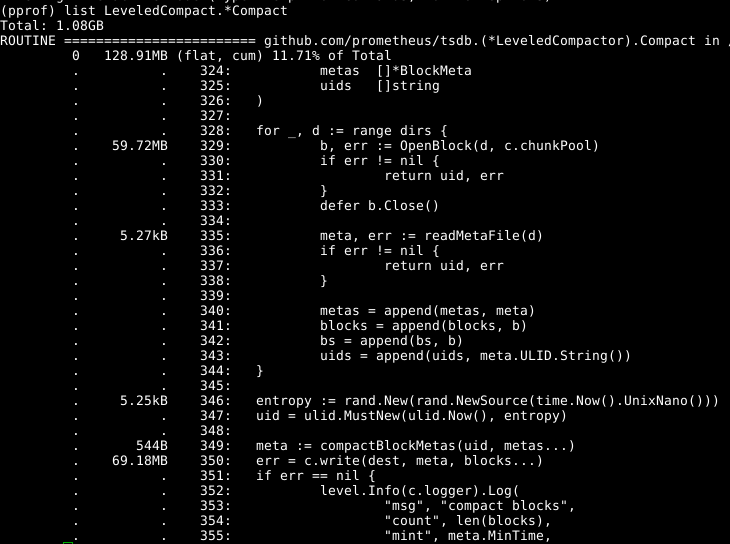
So in this run we see that compaction is allocating around 128MB of RAM, and 60MB of that is line 329 opening blocks. Digging into it, this is all largely the index related data structures. But compaction is almost always done on blocks we already have open in memory, why not reuse those rather than reading them in again? PR 441 did exactly that, roughly halving the memory usage of compaction. Due to how the code is structured, there's no risk of the blocks being closed under us.
Where do we go from here? Line 350 is the rest of the usage. Digging through the code and looking at the web graphical output of pprof it is populateBlock where the usage is, as it builds up combined in-memory index data before writing it all out. This is the same code as what the head block uses for its index, so any improvements from here will also benefit general memory consumption. We can also look at reducing the memory usage of the index data structures for blocks on disk.
This also means we can switch to heap usage, using go tool pprof heap.prof which will give cleaner results. index.newReader is the main function for reading indexes from blocks, and thus responsible for most block-based memory usage:
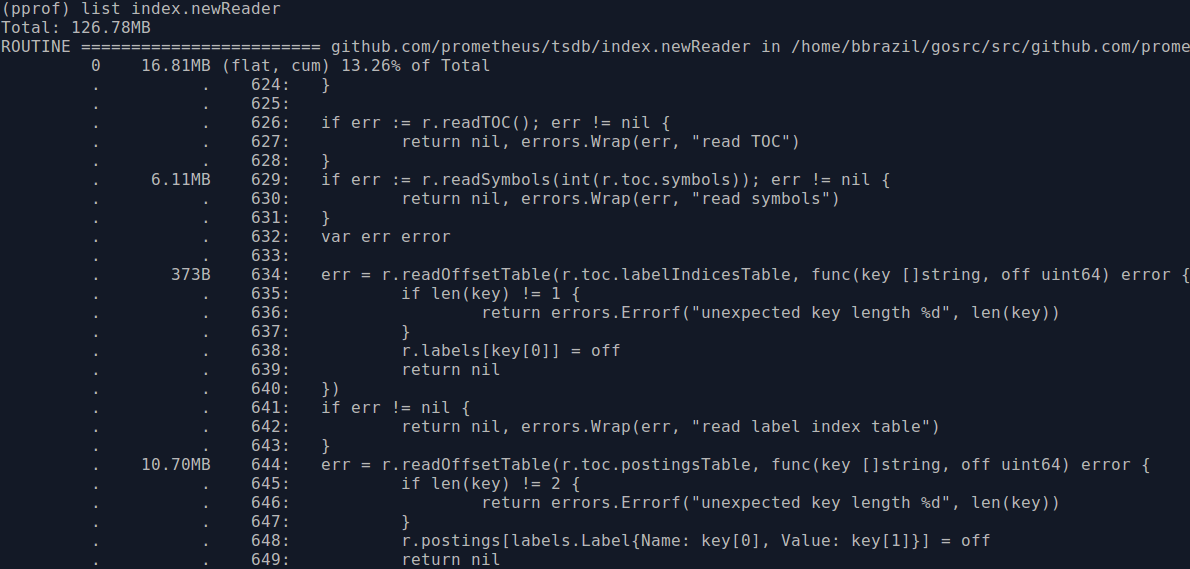
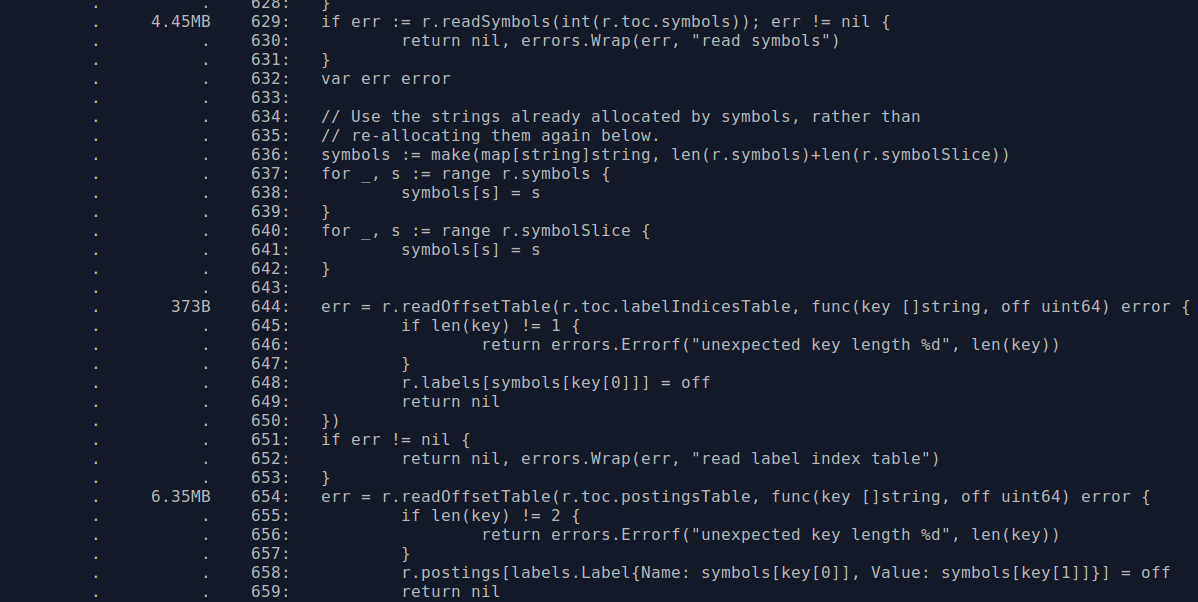
The usage is 6MB from line 629 for the symbols and 10MB within the inner function at line 644 for the postings. Looking through the code, it seems symbol numbers in the previous version of the index were sparse whereas now they are contiguous. So we can use a slice rather than a map for the symbols when using the newer format, which will save some RAM due to removing map overhead and CPU by no longer having to calculate hashes. Another thing is that the symbol strings kept in memory are the same strings that are in the postings, so we could try to reuse the ones we already have rather than allocating duplicate strings for the postings. These changes brought memory usage down nicely:
Another thing is that the postings key is the label name and value in a struct, which is to say that for each distinct label value there's the overhead of also storing its label name. By using a two level map we can avoid this. There's not really a risk of this inadvertently increasing memory usage as the number of label names should generally be below a hundred, and a large number of labels with cardinality one would be quite unusual.
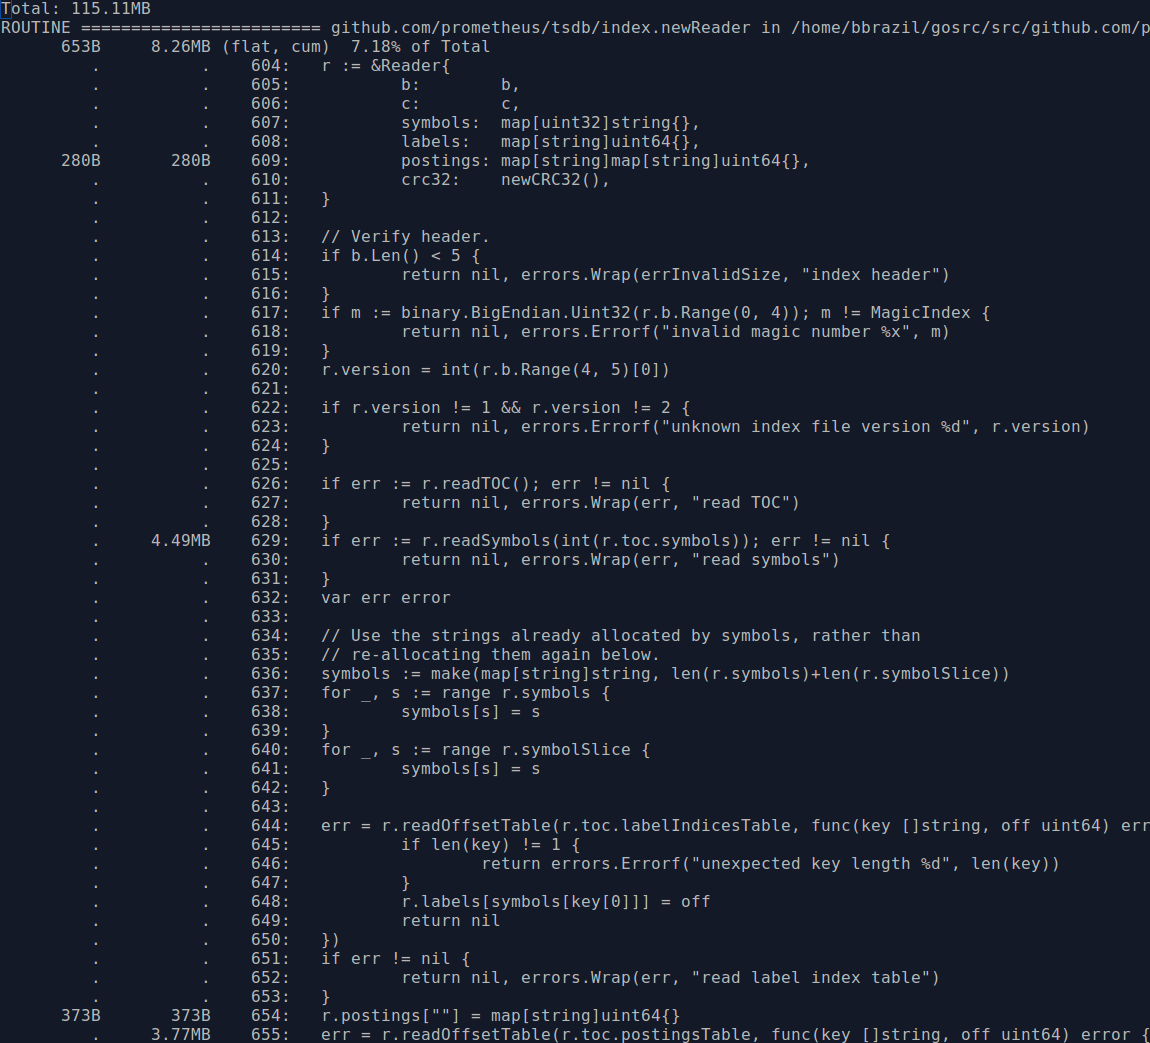
So we've now roughly halved the memory usage for block indexes for this particular test data set. The last technique can also be applied to the head in-memory index data, dropping the usage of MemPostings from 12MB to around 10MB for this data.
Memory optimisation tends to be a bit trickier than CPU optimisation, as often you need to reconsider your data structures while still keeping all the uses of them reasonably performant.
Want to improve performance of your monitoring? Contact us.


No comments.