
The 2.6.0 release of Prometheus includes WAL loading optimisations to make startup faster.
The informal design goal of the Prometheus 2.x TSDB startup was that it should take no more than about a minute. Over the past few months there's been reports of it taking quite a bit more than this, which is a problem if your Prometheus restarts for some reason. Almost all of that time is loading the WAL (write ahead log), which are the samples in the last few hours which have yet to be compacted into a block. I finally got a chance to dig into this at the end of October, and the outcome was PR#440 which reduced CPU time by 6.5x and walltime by 4x. Let's look at how I arrived at these improvements.
Firstly I need a test setup. I created small Go program that produced a TSDB with a WAL that had a billion samples, spread across ten thousand time series. I then opened that TSDB, and saw how long it took using the time utility (not the bash builtin, as that doesn't include memory stats) and also created a CPU profile using the runtime/pprof package:
f, err := os.Create("cpu.prof")
if err != nil {
  log.Fatal(err)
}
pprof.StartCPUProfile(f)
defer pprof.StopCPUProfile()
While a CPU profile doesn't tell us directly about walltime, which is what we care about, it should strongly correlate. The result was that on my desktop machine (an i7-3770 CPU with 16GB of RAM and SSDs) that it was taking about 4 minutes to load and had at peak a bit under 6GB of RAM resident:
1727.50user 16.61system 4:01.12elapsed 723%CPU (0avgtext+0avgdata 5962812maxresident)k
23625165inputs+95outputs (196major+2042817minor)pagefaults 0swaps
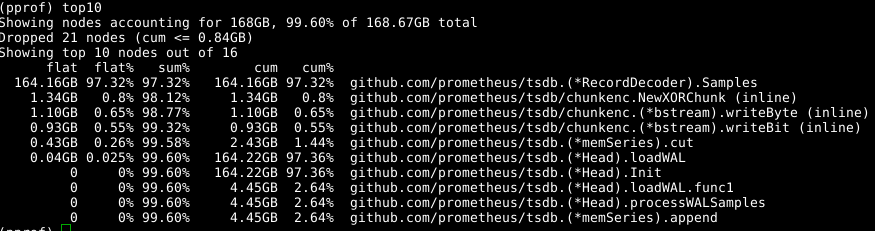
This isn't great, so let's load the profile with go tool pprof cpu.prof and then see where time is spent with the top command:
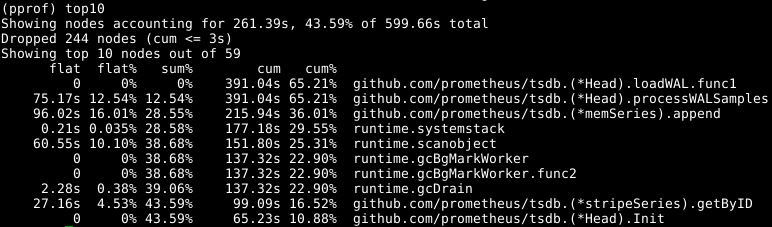
The flat here is the amount of time spent in the given function, and cum is the time spent in the given function and all the functions it called. It can also be useful to view this information as a graph to get a feel for things, I prefer the web command for this but there's other options including svg, png, and pdf files.
We can see that about a third of our CPU is spent adding samples into the in-memory database, about two thirds processing the WAL overall, and a quarter on garbage collection (runtime.scanobject). Let's look at the code for the first of these with list memSeries.*append:
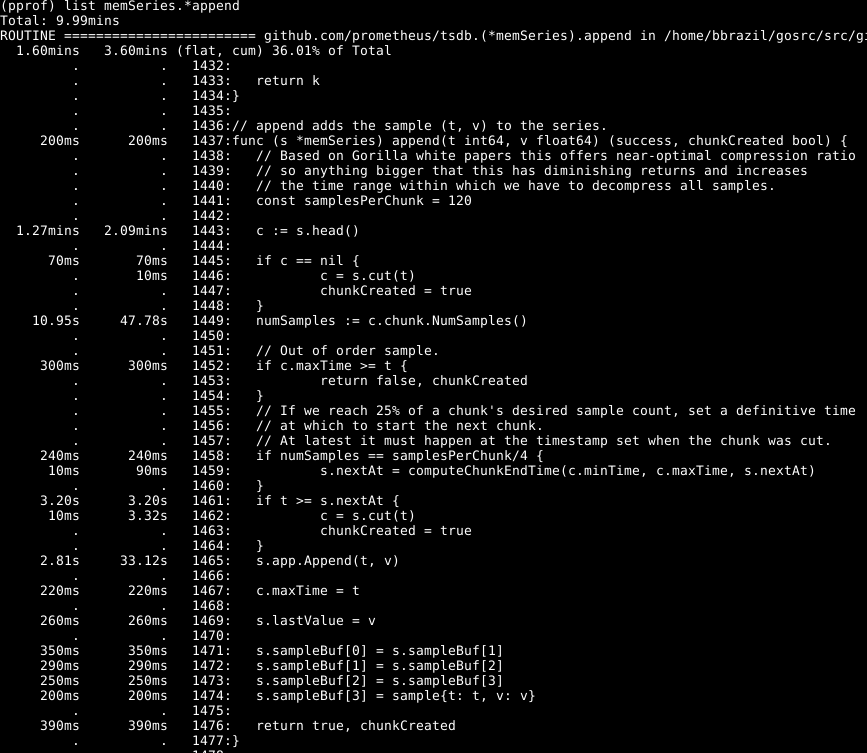
What stands out here to me is that over half of the time is spent getting the head chunk for a series on line 1443, and a good portion of time also spent finding the number of samples in that chunk on line 1449. The time spent appending on line 1465 isn't surprising, as that's the core of what this function does so I'd expect it to dominate the runtime.
Looking at memSeries.head, it's figuring out the chunk to return each time. The chunk only changes every 120ish appends, so we can keep the current head chunk in the series data structure. This does cost a small bit of RAM (which I got back later), but saves a significant amount of CPU. It'll also make general Prometheus ingestion faster.
Next let's look at Head.processWALSamples:
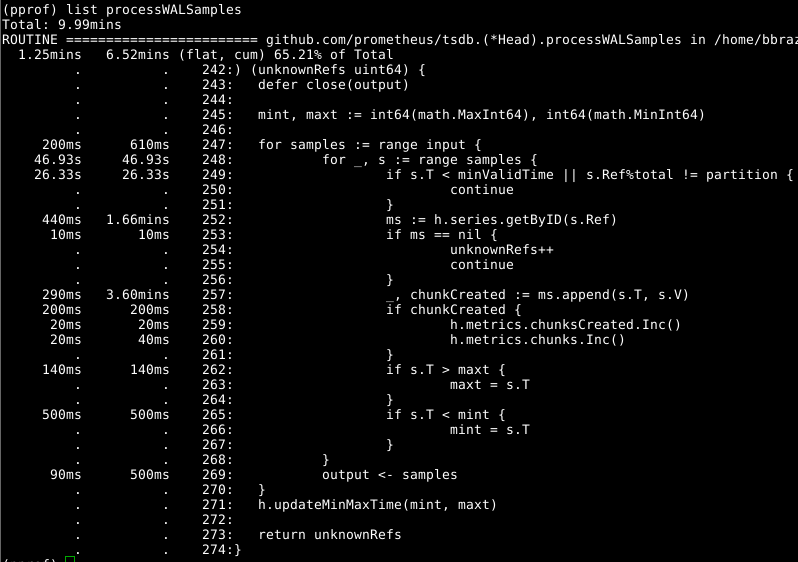
The append we've already optimised above, so the next obvious culprit to look into is getByID on line 252:
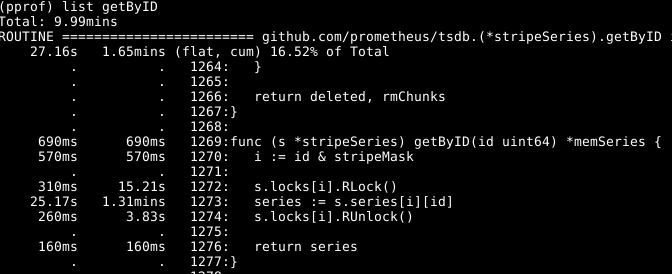
It looks like there's some lock contention, and time being spent doing lookups into a two level map. A per-worker cache of the ids cut this down nicely.
Looking again at Head.processWALSamples the time spent on line 249 is surprising. To step back a bit, how the WAL loading works is that a Head.processWALSamples goroutine is created for every CPU you have, in addition to the one to read and decode the WAL off disk. Series are sharded to these goroutines, so that parallelism can be taken advantage of. The way this is implemented is that all samples are sent to the 1st goroutine, which processes the ones it needs. It then sends all the samples to the 2nd goroutine, which processes the ones it needs and so on until the last Head.processWALSamples goroutine sends everything back to the controlling goroutine.
While this does spread the appends across cores, which is what you want, there's also a lot of duplicated work with each goroutine having to process all the samples, and do that modulus calculation. In fact the more cores you have, the more work is duplicated. I changed this to do the sharding in the conroller goroutine, so each Head.processWALSamples goroutine now only got the samples it needed. This saved only a small amount of walltime on my machine which had 8 goroutines running, but a noticeable amount of CPU. The benefits on machines with more cores should be quite a bit larger.
That leaves one thing more that stood out, the time spent on garbage collection. That's not something we can (usually) spot via CPU profiles. Instead we need to look at heap profiles, to see where things are being allocated. This needs a bit more code near the end of our program:
runtime.GC()
hf, err := os.Create("heap.prof")
if err != nil {
  log.Fatal(err)
}
pprof.WriteHeapProfile(hf)
The explicit garbage collection is as some heap-related information is only collected at garbage collection time.
We use the same tool again, though specifying the -alloc_space flag as we care about total allocations rather than what is using memory right now, so go tool pprof -alloc_space heap.prof. Looking at the top allocaters there's an obvious culprit:
Looking at the code:
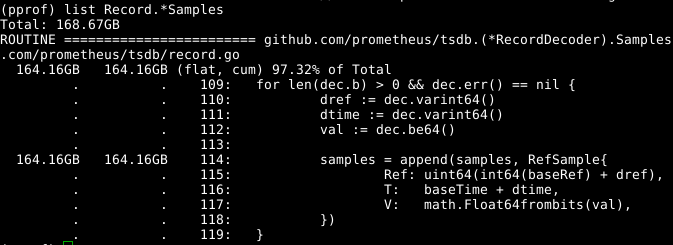
It seems that the samples array being expanded is the issue. If we could reuse the array across calls to RecordDecoder.Samples that would save a lot of allocations. It turns out that the code was written to work that way, but a subtle coding error meant that it wasn't working. Fixing that lead to GC using 8 seconds of CPU time rather than 151 seconds.
The overall results are quite noticeable:
269.18user 10.69system 1:05.58elapsed 426%CPU (0avgtext+0avgdata 3529556maxresident)k
23174929inputs+70outputs (815major+1083172minor)pagefaults 0swap
In addition to reducing wall time by 4x and CPU by 6.5x, resident memory also dropped by over 2GB.
The above may seem almost easy, but that's due to me being reasonably familiar with the codebase, and having the benefit of hindsight. I did spend quite a bit of time pouring over the code, and had several dead ends such as removing the call to NumSamples, doing reading and decoding in separate threads, and a few variants of how the processWALSamples sharding worked. I'm fairly certain there is more to be gained by adjusting the number of goroutines, but to do it properly it'd need to be tested on a machine with more cores than I had to hand. Given I'd already gotten the performance improvements I was looking for, and it's best not to make PRs too large, I just went with what I'd done so far.
Want to improve performance of your monitoring? Contact us.


No comments.