
Want to learn how to monitor a Kafka instance that's inside of a Docker container?
Previously we've looked at monitoring Kafka using Prometheus. Like the last post on this topic, we'll be using the JMX exporter to expose Kafka's metrics for our Prometheus to scrape.
This time however, Kafka and the JMX exporter Java agent will be inside of a Docker container.
This blogpost assumes that you already have Docker and Docker Compose installed on your machine.
Begin by grabbing the example code which contains a Docker setup that will spin up Zookeeper (a Kafka dependency), a Kafka instance, the JMX exporter agent, and a Prometheus instance to monitor it all.
Do this by running docker-compose up inside of the prometheus_kafka/ directory.
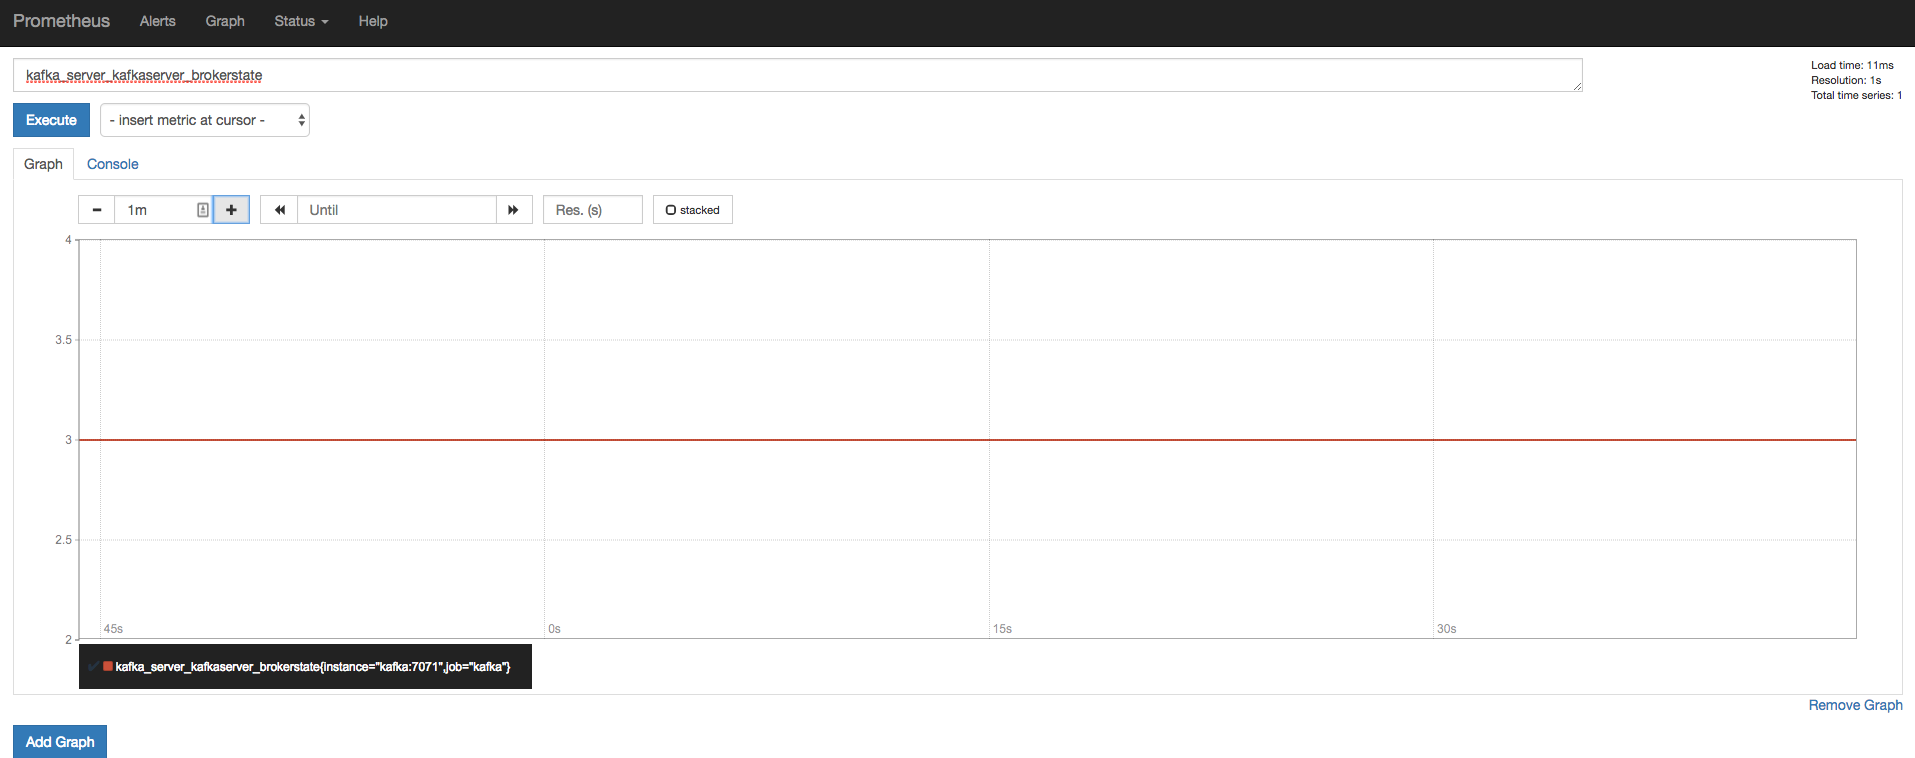
You should now be able to head over to Prometheus and query some Kafka, JMX, and JVM metrics.
If you wish to edit the Prometheus configuration file, you can find it under mount/prometheus/prometheus.yml. It's currently set to simply scrape the running JMX exporter agent.
The ports and host name of each component may be configured inside of docker-compose.yml for a non localhost setup.
Need help monitoring Kafka, Java apps, or other Dockerized applications? Contact us.


No comments.