
We've previously looked at how to monitor Cassandra with Prometheus. Let's see the process for getting metrics from another popular Java application, Kafka.
Similar to what we did for Cassandra, we download Kafka, the JMX exporter and the config file:
wget http://ftp.heanet.ie/mirrors/www.apache.org/dist/kafka/1.0.0/kafka_2.11-1.0.0.tgz
tar -xzf kafka_*.tgz
cd kafka_*

wget https://repo1.maven.org/maven2/io/prometheus/jmx/jmx_prometheus_javaagent/0.6/jmx_prometheus_javaagent-0.6.jar
wget https://raw.githubusercontent.com/prometheus/jmx_exporter/master/example_configs/kafka-0-8-2.yml
We start a Zookeeper (a Kafka dependency) and Kafka with the JMX exporter running as a Java agent:
./bin/zookeeper-server-start.sh config/zookeeper.properties &
KAFKA_OPTS="$KAFKA_OPTS -javaagent:$PWD/jmx_prometheus_javaagent-0.2.0.jar=7071:$PWD/kafka-0-8-2.yml" \
  ./bin/kafka-server-start.sh config/server.properties &
If you visit :7071/metrics you'll see the metrics.
Let's setup a quick Prometheus server:
wget https://github.com/prometheus/prometheus/releases/download/v2.0.0/prometheus-2.0.0.linux-amd64.tar.gz
tar -xzf prometheus-*.tar.gz
cd prometheus-*
cat <<'EOF' > prometheus.yml
global:
 scrape_interval: 10s
 evaluation_interval: 10s
scrape_configs:
 - job_name: 'kafka'
   static_configs:
    - targets:
      - localhost:7071
EOF
./prometheus
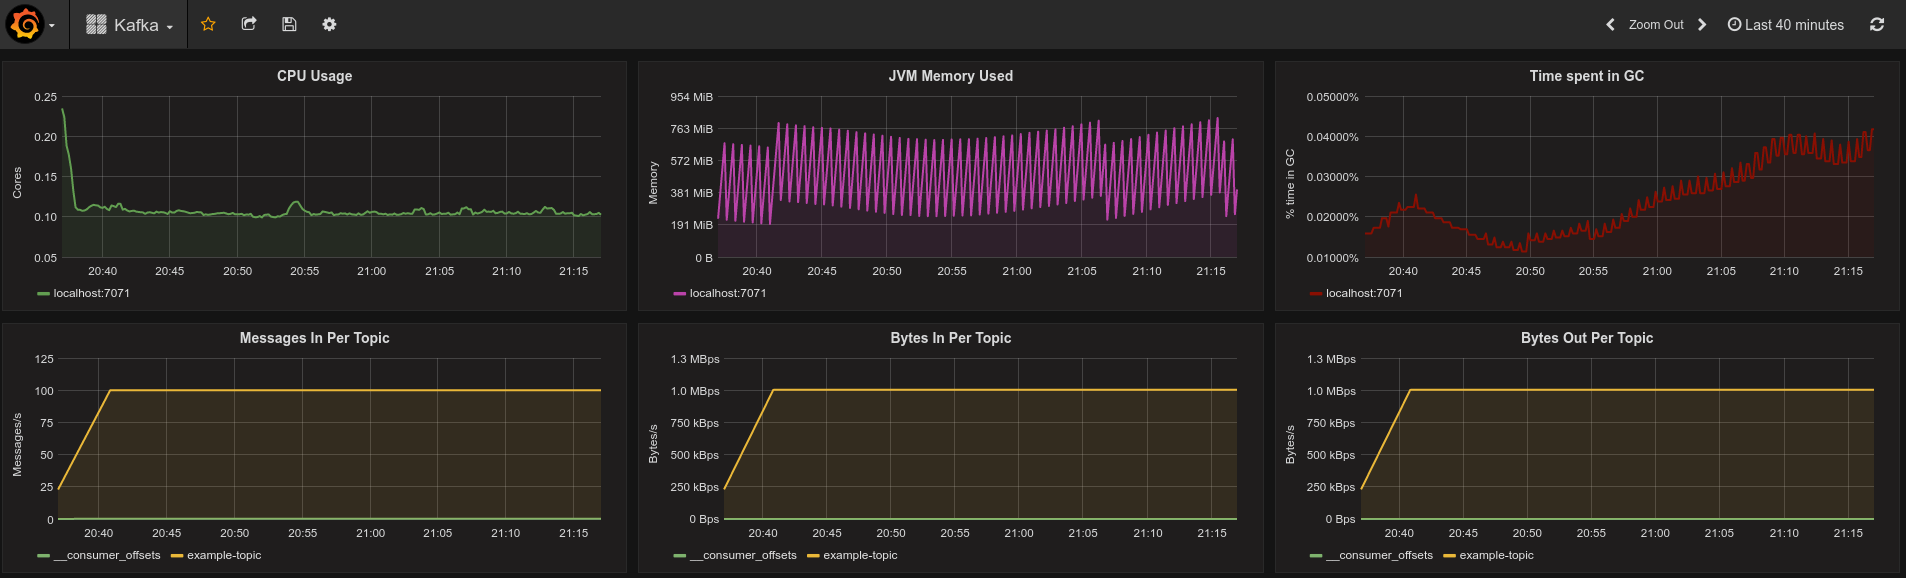
Finally load the Kafka Overview dashboard from grafana.net into your Grafana to get the above console!
If you want to run Kafka inside docker, there's another blog post covering that.
Want to learn more about how to monitor JVM applications? Contact us.


No comments.