
I previously looked at how the Prometheus Python client can output to Graphite. You can do the same with the Java client, letting you instrument once and integrate with non-Prometheus monitoring systems.
If you're using Maven, the key dependency you need is simpleclient_graphite_bridge:
<dependency>
  <groupId>io.prometheus</groupId>
    <artifactId>simpleclient_graphite_bridge</artifactId>
  <version>0.0.13</version>
</dependency>
Sending samples out to Graphite is then only a few lines of code, here's a small example program:
package io.robustperception.java_examples;

import io.prometheus.client.CollectorRegistry;
import io.prometheus.client.bridge.Graphite;
import io.prometheus.client.hotspot.DefaultExports;

public class JavaGraphiteBridge {
 public static void main(String[] args) throws Exception {
 // Add metrics about CPU, JVM memory etc.
 DefaultExports.initialize();

 Graphite g = new Graphite("localhost", 2003);
 // Send to graphite every 60s.
 Thread thread = g.start(CollectorRegistry.defaultRegistry, 60);
 thread.join(); // Waits forever.
 }
}
A complete example Maven project is available on github. Let's download it and run it:
git clone https://github.com/RobustPerception/java_examples.git
cd java_examples/java_graphite_bridge/
mvn package
java -jar target/java_graphite_bridge-1.0-SNAPSHOT-jar-with-dependencies.jar
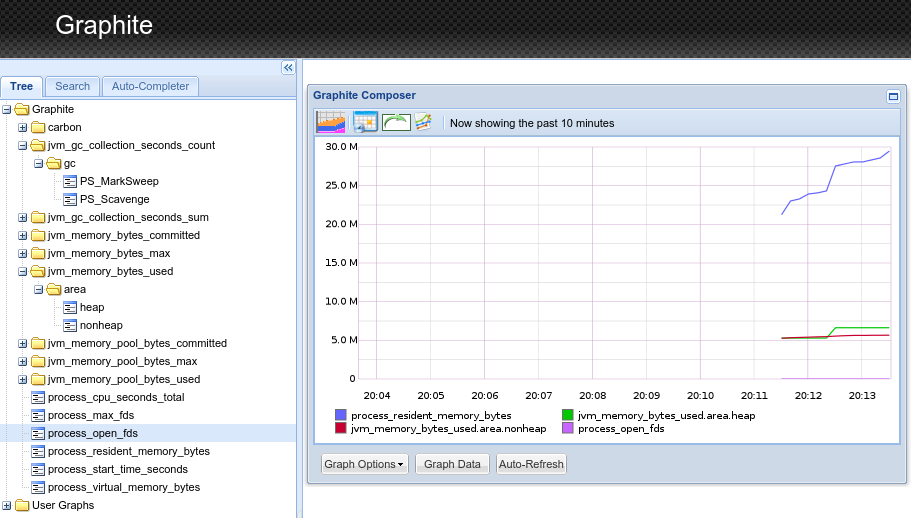
This will send data to your Graphite on port 2003 on localhost. If you don't have a Graphite running there, nc -l 2003 will allow you to capture the samples.


No comments.