
Prometheus doesn't try to lock you into it's ecosystem - in fact it makes it straightforward to both get data both in and out. This reduces operational overhead and allows for smoother transitions between monitoring systems.
To demonstrate this, let's write a trivial Python program that exposes Prometheus metrics and also writes them to Graphite.
First install the Prometheus Python client:
pip install prometheus_client
Next create and run the program:
cat <<'EOF' > demo.py
from prometheus_client import start_http_server, Summary
from prometheus_client.bridge.graphite import GraphiteBridge
import random
import time

REQUEST_TIME = Summary('request_processing_seconds',
        'Time spent processing request')

@REQUEST_TIME.time()
def process_request(t):
    """A dummy function that takes some time."""
    time.sleep(t)

if __name__ == '__main__':
    # Start up the server to expose the Prometheus metrics.
    start_http_server(8000)

    # Push to graphite every 10 seconds
    gb = GraphiteBridge(('graphite.your.org', 2003))
    gb.start(10)

    # Generate some requests.
    while True:
        process_request(random.random())
EOF
python demo.py
If you visit :8000/metrics you'll see the Prometheus metrics, and they're there in your Graphite console too:
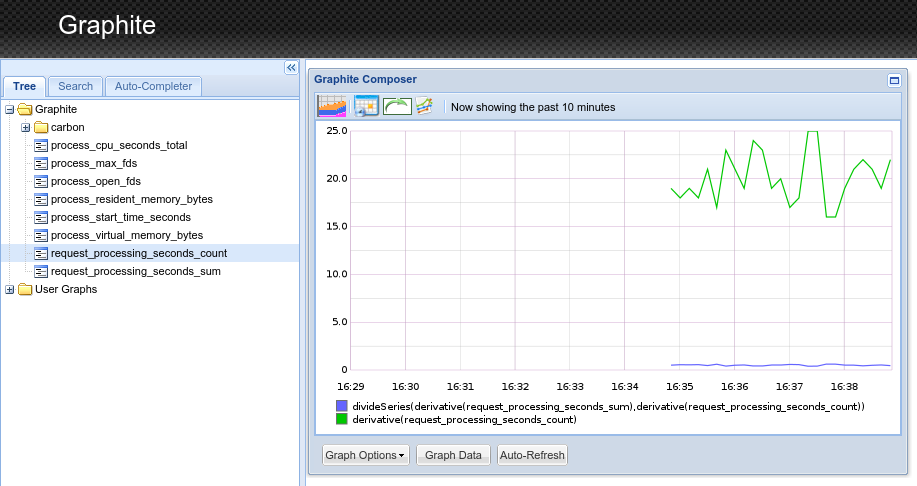
This ability to talk to multiple monitoring systems means that you as a library author can instrument your code with a Prometheus client library without having to worry about which monitoring systems your users are using. Your users also benefit as they can take advantage of your instrumentation without having to install a new monitoring system!


No comments.