
We previously looked at finding your biggest metrics, that involves an expensive query though. A new feature in Prometheus 1.3 offers another approach.
scrape_samples_scraped, like up, is a time series automatically generated by Prometheus as part of doing a scrape. It reports the numbers of samples that the target produced, before metric_relabel_configs is applied.
This can be used as a very quick and cheap way to pinpoint a target that has started to produce many more samples than it used to. To do so is as simple as putting the expression scrape_samples_scraped in the graph view in the expression browser:
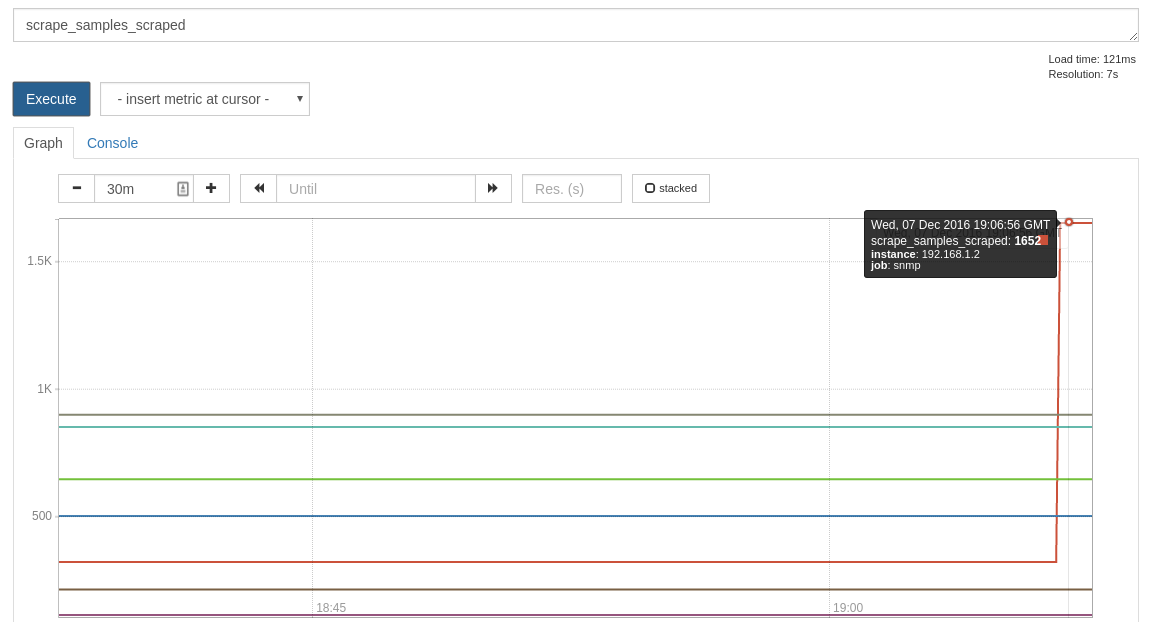
In this case the recent load increase is obviously due to SNMP, so you know where to start debugging.
A related metric is scrape_samples_post_metric_relabeling, which was added in 1.5.0.
Want to understand resource tradeoffs in metrics? Contact us.


No comments.