
As your Prometheus usage grows and starts to get loaded, it'd be useful to know which metrics are using the most resources so that you can re-evaluate their utility.
PromQL is Prometheus' query language, that allows you to perform powerful calculations across your data. It can be used not only to analyse the metrics from your individual services, but also to analyse across all the metrics inside your Prometheus server.
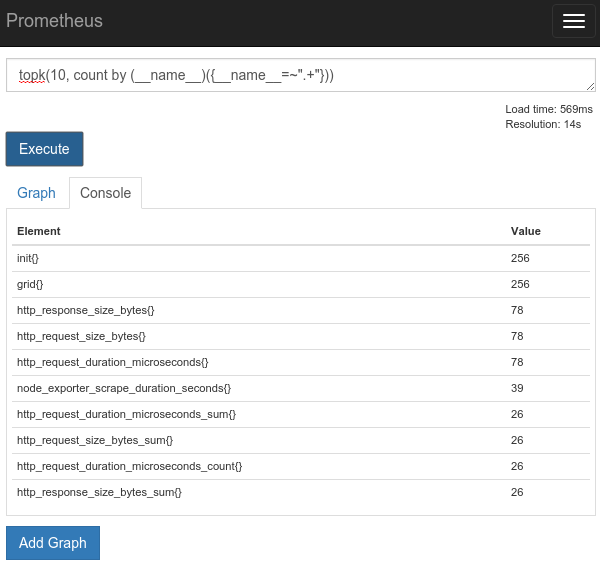
To know which metrics are using the most resources it'd be good to count how many time series each has, and then display the top 10. This can be done with an expression selecting all metrics, aggregating a count based on the metric name and returning the top 10 in the expression browser (make sure to use the Console view):
topk(10, count by (__name__)({__name__=~".+"}))
On the live demo this shows that Conway's Life has the biggest time series:
We could also aggregate it by job:
topk(10, count by (__name__, job)({__name__=~".+"}))
Or see which jobs have the most time series:
topk(10, count by (job)({__name__=~".+"}))
Beware that as these queries touch all time series they are relatively expensive, so it'd be best not to hammer your Prometheus with queries of this nature.


No comments.