
Have you ever wondered what percentage of time a given service or application spends up or down?
In this blogpost we'll demonstrate how to use the Blackbox exporter with Prometheus in order to achieve this.
Setting up a simple contrived example, we'll run both the Blackbox and Node exporter, and configure Prometheus to tell the Blackbox exporter to issue a simple HTTP probe to the node exporter and scrape the result.
global:
  scrape_interval:    5s
  evaluation_interval: 5s

scrape_configs:
  - job_name: 'node'
    metrics_path: /probe
    params:
      module: [http_2xx]  # Look for a HTTP 200 response.
    static_configs:
      - targets:
        - :9100
    relabel_configs:
      - source_labels: [__address__]
        target_label: __param_target
      - source_labels: [__param_target]
        target_label: instance
      - target_label: __address__
        replacement: 127.0.0.1:9115  # The blackbox exporter's real hostname:port.
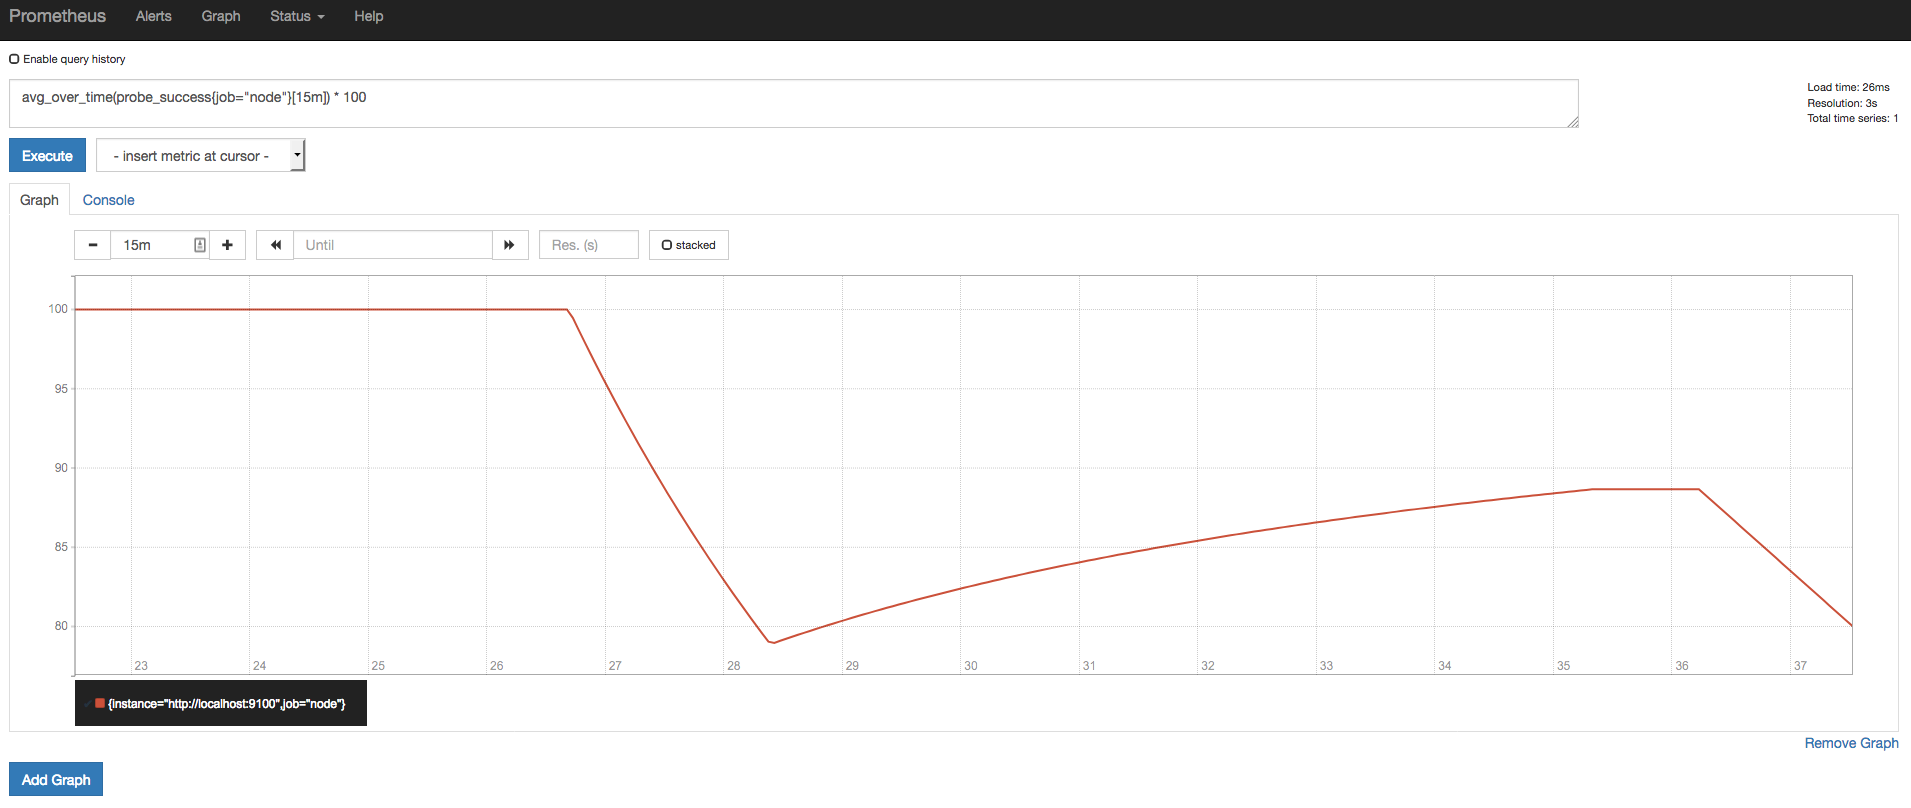
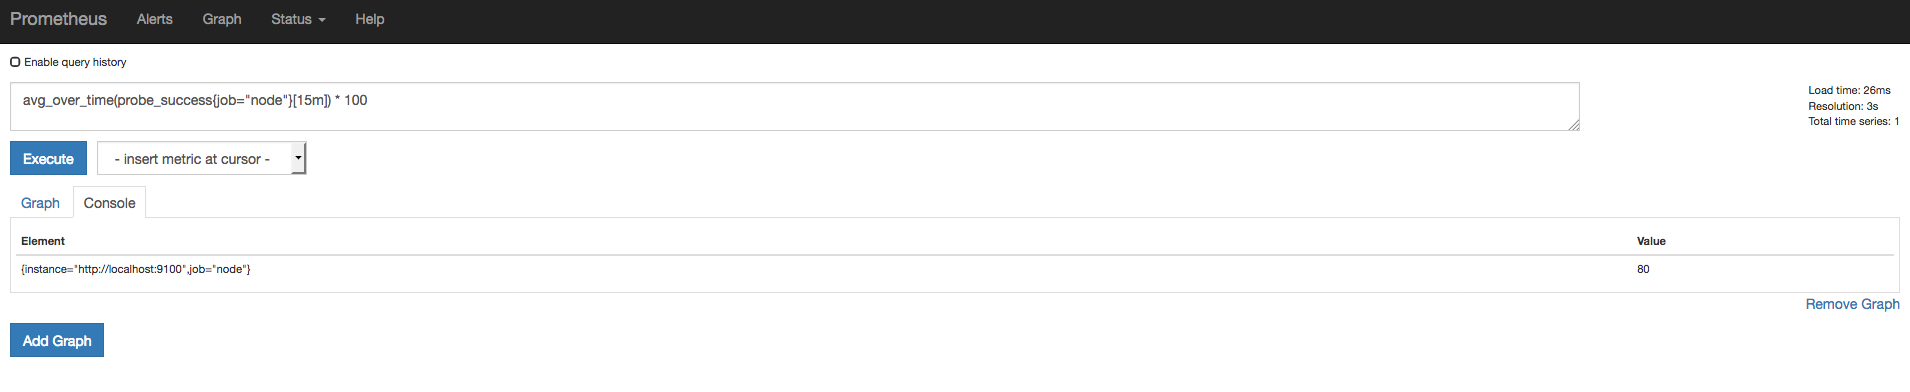
Using the query function avg_over_time() we can get the average value of the blackbox exporter's probe_success metric over a given time period which simply reports 1 or 0 depending on whether the target probed responds with a HTTP 200 response for our given probe.
The examples below show the result of this query function when looking at probe_success over a period of 15 minutes. We multiply by 100 to get a percentage.
In order to get a percentage of 80%, I killed the Node exporter for a few minutes.
(The full query used is avg_over_time(probe_success{job="node"}[15m]) * 100
Interested in gaining more operational insights with Prometheus? Contact us.


No comments.