
When you've broken a metric out into labels a common need is to tell what proportion each label represents of the total. The group_left modifier of Prometheus is the key.
We previously looked at group_left in the context of machine roles. Here the use case is different as there's only one metric with one set of labels involved. We'll take the example of machine CPU, and unlike the last time we won't take advantage of the fact that it happens to sum to 1.0.
As a reminder machine cpu usage comes from a metric called node_cpu and has the basic structure:
# HELP node_cpu Seconds the cpus spent in each mode.
# TYPE node_cpu counter
node_cpu{cpu="cpu0",mode="idle"} 2.03442237e+06
node_cpu{cpu="cpu0",mode="system"} 6605.46
node_cpu{cpu="cpu0",mode="user"} 23343.01
node_cpu{cpu="cpu1",mode="idle"} 2.03471439e+06
node_cpu{cpu="cpu1",mode="system"} 6581.92
node_cpu{cpu="cpu1",mode="user"} 23171.06
What we'd like to know is the proportion of the time each mode takes on each machine.
What we need is the total for each mode for each machine:
sum without (cpu)(rate(node_cpu[1m]))
And the total for each machine:
sum without (mode, cpu)(rate(node_cpu[1m]))
But how do we combine these together? A standard division binary operation won't help, as there's an extra mode label in the first expression compared to the second.
This is where group_left comes in. It says that for each set of matching labels, many time series on the left hand side can match with just one time series on the right hand side. It'll then perform the binary operation, and keep all the labels of the left hand side.
This gives us the expression.
  sum without (cpu)(rate(node_cpu[1m]))
/ ignoring(mode) group_left
  sum without (mode, cpu)(rate(node_cpu[1m]))
Under the covers the matching looks like:
| LHS | RHS |
|---|---|
| {mode="idle",instance="machine1",job="node"} | {instance="machine1",job="node"} |
| {mode="user",instance="machine1",job="node"} | |
| {mode="system",instance="machine1",job="node"} | |
| {mode="idle",instance="machine2",job="node"} | {instance="machine2",job="node"} |
| {mode="user",instance="machine2",job="node"} | |
| {mode="system",instance="machine2",job="node"} |
Graphing it produces the desired result:
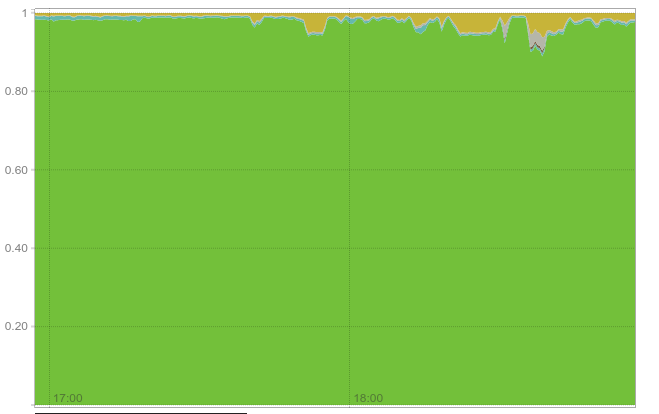
Proportion of CPU time spent in each mode
Additional Options
group_left can take a list of labels, which will be copied from the smaller right hand side.
There is also group_right which is similar to group_left, except that it swaps the left and right hand side. To help remember which is which group_left has the bigger group of time series on the left.
Note that this post uses features that were added for the 0.19.0 release.


No comments.