
High CPU load is a common cause of issues. Let's look at how to dig into it with Prometheus and the Node exporter.
On a Node exporters' metrics page, part of the output is:
# HELP node_cpu Seconds the cpus spent in each mode.
# TYPE node_cpu counter
node_cpu_seconds_total{cpu="0",mode="guest"} 0
node_cpu_seconds_total{cpu="0",mode="idle"} 2.03442237e+06
node_cpu_seconds_total{cpu="0",mode="iowait"} 3522.37
node_cpu_seconds_total{cpu="0",mode="irq"} 0.48
node_cpu_seconds_total{cpu="0",mode="nice"} 515.56
node_cpu_seconds_total{cpu="0",mode="softirq"} 953.06
node_cpu_seconds_total{cpu="0",mode="steal"} 0
node_cpu_seconds_total{cpu="0",mode="system"} 6605.46
node_cpu_seconds_total{cpu="0",mode="user"} 23343.01
node_cpu_seconds_total{cpu="1",mode="guest"} 0
node_cpu_seconds_total{cpu="1",mode="idle"} 2.03471439e+06
node_cpu_seconds_total{cpu="1",mode="iowait"} 3633.5
node_cpu_seconds_total{cpu="1",mode="irq"} 0.58
node_cpu_seconds_total{cpu="1",mode="nice"} 542.05
node_cpu_seconds_total{cpu="1",mode="softirq"} 880.49
node_cpu_seconds_total{cpu="1",mode="steal"} 0
node_cpu_seconds_total{cpu="1",mode="system"} 6581.92
node_cpu_seconds_total{cpu="1",mode="user"} 23171.06
This metric comes from /proc/stat and tell us how many seconds each CPU spent doing each type of work:
- user: The time spent in userland
- system: The time spent in the kernel
- iowait: Time spent waiting for I/O
- idle: Time the CPU had nothing to do
- irq&softirq: Time servicing interrupts
- guest: If you are running VMs, the CPU they use
- steal: If you are a VM, time other VMs "stole" from your CPUs
These modes are mutually exclusive. A high iowait means that you are disk or network bound, high user or system means that you are CPU bound.
These are counters, so to calculate the per-second values we use the rate function in the expression browser:
rate(node_cpu_seconds_total{job="node"}[1m])
We can aggregate this to get the overall value across all CPUs for the machine:
sum by (mode, instance) (rate(node_cpu_seconds_total{job="node"}[1m]))
As these values always sum to one second per second for each cpu, the per-second rates are also the ratios of usage. We can use this to calculate the percentage of CPU used, by subtracting the idle usage from 100%:
100 - (avg by (instance) (rate(node_cpu_seconds_total{job="node",mode="idle"}[1m])) * 100)
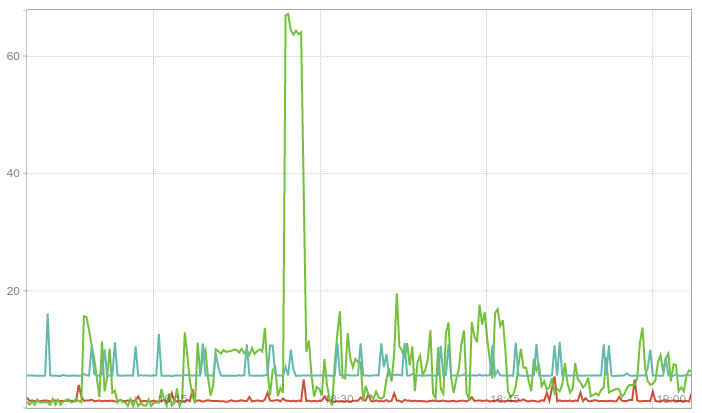
CPU Used % across several machines


No comments.