
Prometheus isn't limited to monitoring just machines and applications, it can provide insight for any system you can get metrics out of. That includes network devices, so let's look at how to monitor SNMP.
First off, let's install and run the SNMP exporter:
wget https://github.com/prometheus/snmp_exporter/releases/download/v0.6.0/snmp_exporter-0.6.0.linux-amd64.tar.gz
tar -xzf snmp_exporter-0.6.0.linux-amd64.tar.gz
cd snmp_exporter-*
./snmp_exporter
If you visit :9116 you can verify it's running.
Next let's configure Prometheus to scrape it (be sure to add your SNMP devices under 'targets' in the following prometheus.yml configuration file):
wget https://github.com/prometheus/prometheus/releases/download/v2.0.0/prometheus-2.0.0.linux-amd64.tar.gz
tar -xzf prometheus-2.0.0.linux-amd64.tar.gz
cd prometheus-*
cat <<'EOF' > prometheus.yml
global:
  scrape_interval: 10s
  evaluation_interval: 10s
scrape_configs:
  - job_name: 'snmp'
    metrics_path: /snmp
    params:
      module: [if_mib]
    static_configs:
      - targets:
        - 192.168.1.2  # SNMP device - add your IPs here
    relabel_configs:
      - source_labels: [__address__]
        target_label: __param_target
      - source_labels: [__param_target]
        target_label: instance
      - target_label: __address__
        replacement: 127.0.0.1:9116  # SNMP exporter.
EOF
./prometheus &
If you wait a bit for some scrapes to happen, you can then visit :9090/graph to see interface statistics.
The SNMP exporter was deployed at FOSDEM last weekend, and we were able to produce a variety of useful dashboards in Grafana covering things like bandwidth and WiFi usage.
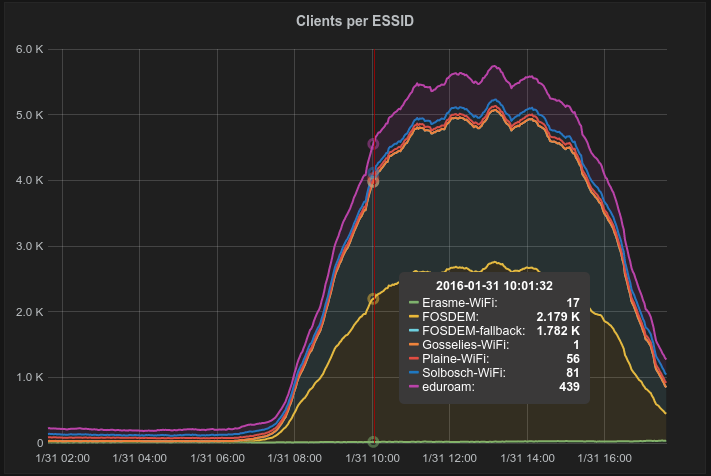
ESSID usage during FOSDEM


No comments.