
Have you ever wanted to have a table showing multiple metrics across all of your instances?
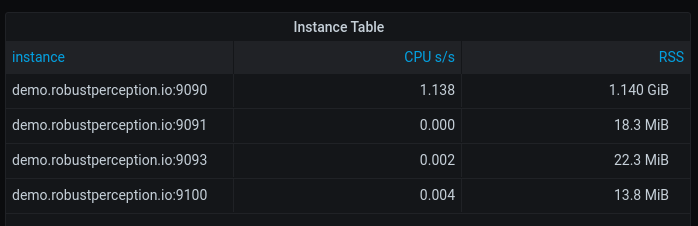
I'm going to show you how to show CPU usage and RSS for all of your instances, here I'm using Grafana 7.1.1 and the end result will look something like:
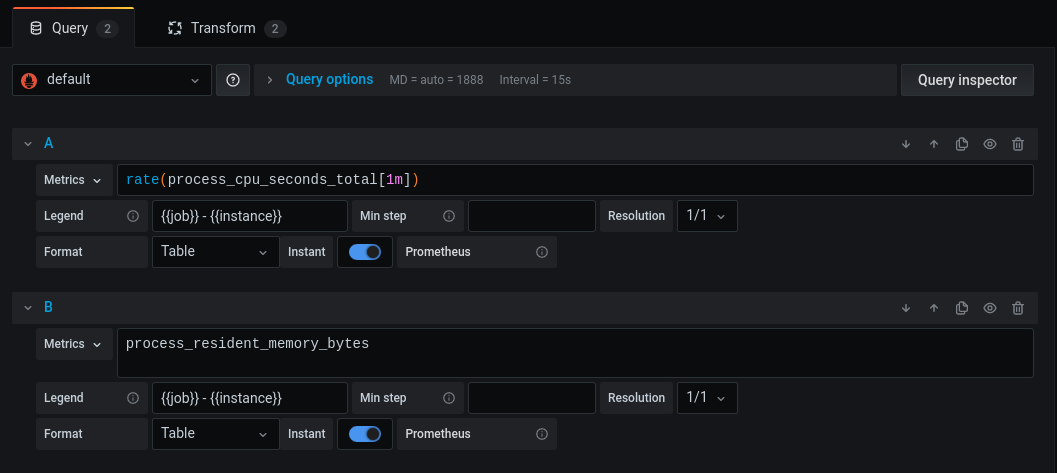
First create a Table panel, and define your queries. The key settings are that the Format should be Table, and the queries are Instant:
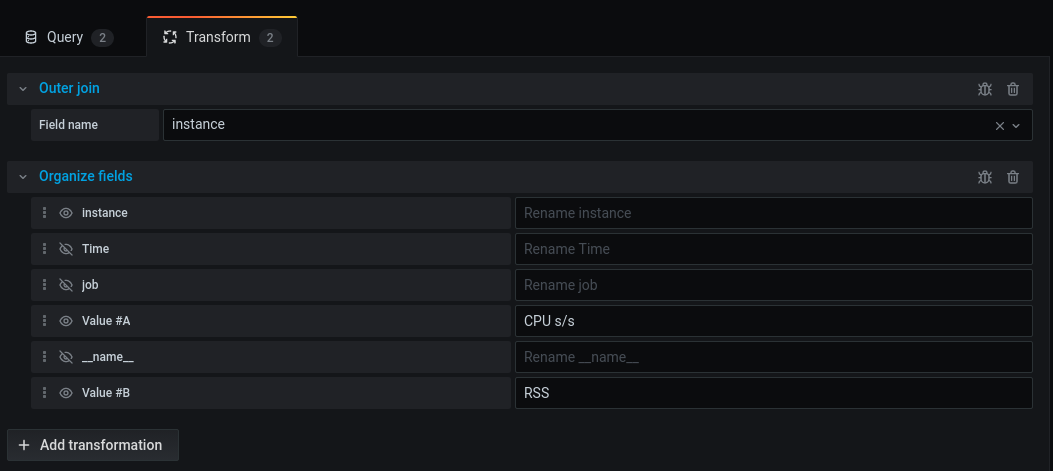
Next in Transform do an Outer join on the instance label, and then Organize fields to hide and rename columns:
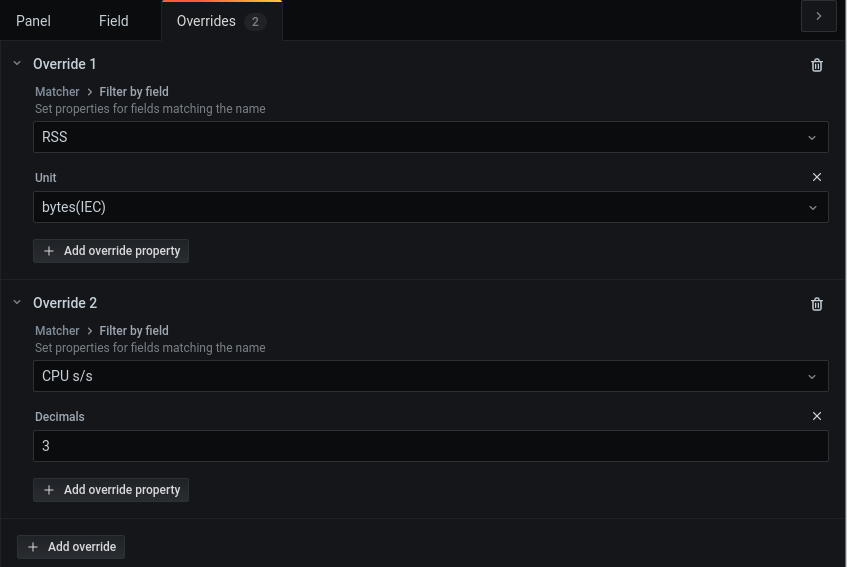
Finally to add some polish, set units and limit decimals via the Overrides in the Options pane:
This can be expanded to add additional columns and metrics.
Looking to have more useful dashboards? Contact us.


No comments.