
Many of the companies I talk to either want to move off Graphite, or are already doing so. Let's look at how to get your existing data that's going to Graphite into Prometheus instead.
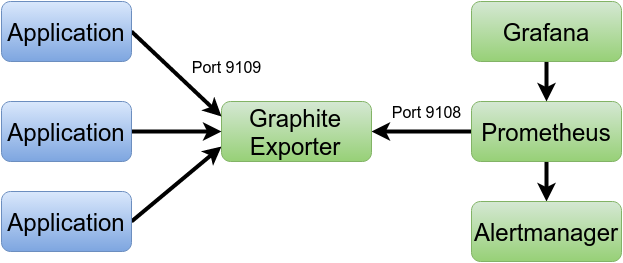
Prometheus uses an advanced pull model to collect metrics, allowing for easy detection of failed servers and making it easy to run your own development Prometheus server for against production data. As Graphite uses a push model, we'll use the Graphite Exporter to bridge this gap.
First let's get the Graphite Exporter running:
wget https://github.com/prometheus/graphite_exporter/releases/download/v0.2.0/graphite_exporter-0.2.0.linux-amd64.tar.gz
tar -xzf graphite_exporter-0.2.0.linux-amd64.tar.gz
cd graphite_exporter-*
./graphite_exporter &
Now change your existing systems to send their samples to the Graphite Exporter on port 9109. It accepts the Graphite plaintext protocol on both TCP and UDP. Once that's done, you'll see your metrics on :9108/metrics.
Next let's setup a quick Prometheus server:
wget https://github.com/prometheus/prometheus/releases/download/v2.0.0/prometheus-2.0.0.linux-amd64.tar.gz
tar -xzf prometheus-2.0.0.linux-amd64.tar.gz
cd prometheus-*
cat <<'EOF' > prometheus.yml
global:
 scrape_interval: 10s
 evaluation_interval: 10s
scrape_configs:
 - job_name: 'graphite'
   honor_labels: true
   static_configs:
    - targets:
      - localhost:9108
EOF
./prometheus
If you visit :9090 you'll be able to play with your new Prometheus server and take advantage of the power of PromQL. Beyond the expression browser, you can also setup Grafana for dashboards, create alerting rules and use mapping configurations to add labels to get the most out of Prometheus!


No comments.