
On a regular basis a potential Prometheus user says they need a different architecture to make things reliable or scalable. Let's look at that.
Once or twice a month I see someone propose a Prometheus architecture that looks something like this:
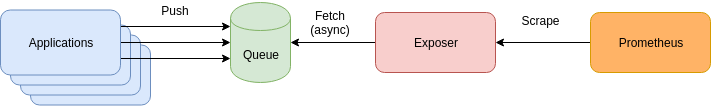
Applications push metrics to some form of queue (usually Kafka), an exposer binary reads from the queue and provides all the application metrics since the last scrape to Prometheus. Details vary, often there's sharding and redundancy involved. In some cases the queue and exposer are combined, possibly in the form of the Pushgateway by those who mistakenly believe that it queues. On rare occasions the push is a pull.
The reasons given for this design are usually one of that this is the required enterprise architecture that has been handed down, it's to reduce latency, it's needed for scalability, or it's for reliability.
Let's pause for a moment and talk about the word "reliability". Prometheus is a monitoring system, so reliability in this context means that your alerts continue to arrive promptly and you can still do debugging when things are falling apart. It does not mean losing absolutely no data. Prometheus is a monitoring system that contains a custom TSDB, rather than a TSDB in and of itself. If you're looking for a more traditional TSDB, then consider options like InfluxDB and Cassandra.
So given the meaning of reliability in the monitoring sense, what are some of the issues with the above classes of design?
The first is the communication between the application and the queue. If that isn't working, then applications would need to buffer up metrics likely in RAM. Taking more resources when things are broken can lead to bad problems getting worse, such as say if the queue was shared with other systems and causing them to build backlogs in RAM too. You can't presume that queues are reliable, particularly when there's consensus mechanisms involved. For example Kafka leader election can take a while (though I believe newer versions no longer do it in serial partition by partition). There's always the possibility of overload or an unexpectedly hitting a resource limit. By contrast the Prometheus approach is constant memory.
The second is that metrics aren't being produced synchronously when Prometheus scrapes. This can cause artifacts due to misalignment of data (especially if there's jitter in the propagation delay), and delayed time series would be erroneously marked as stale when they wasn't returned in a scrape. You may think that adding timestamps would handle this, but then you lose the benefits of staleness handling. Recording rules and queries won't consistently have up to date data, leading to odd graphs and incorrect alerts. So in terms of timestamps you can neither have your cake, nor eat it. Handling of multiple samples from the same time series with different timestamps in one scrape is also technically undefined behaviour.
The third is an issue of scalability. Prometheus scraping is designed for many many small targets, not a handful of massive targets. Having a single exposer provide hundreds of thousands of samples for a single scrape means that you also need Prometheus to be able to parse and ingest those metrics within the scrape interval - or Prometheus will treat the scrape as failed. By centralising scraping through the exposer scalability is actually made worse, as it is now a one CPU core bottleneck that needs careful management to ensure that scrapes continue to succeed. These are the same issues you'd run into with misusing federation. For the rare users for whom even the approaches listed in Scaling and Federating Prometheus aren't sufficient then I'd suggest considering Cortex, rather than gradually reinventing it.
The fourth is the lack of service discovery and ingestion controls. As Prometheus only knows about the exposer, it won't have an up time series for each target so you'd have to implement some other solution to provide that functionality. You also lose the various other scrape_ metrics that are useful for finding troublesome targets, and the scrape_limit feature to contain their impact.
So going against the grain of Prometheus's design isn't exactly gaining you much, and in fact overall will likely make your system less reliable, and less scalable, than a standard setup where Prometheus directly scrapes the applications.
This is not the say that you should never use queues, there's plenty of valid use cases for them. Prometheus is not one of them though, as it has been designed with a different set of engineering tradeoffs in mind.
Have questions about scaling Prometheus? Contact us.


No comments.