
As I mentioned in a previous post, I made some memory-related improvements to Prometheus that'll be in the 1.5 release. Let's look at how I came across unneeded memory allocations and ultimately improved the code.
My initial goal was to provide guidance to Prometheus users on how many resources they should provision for a given load and what flag settings were appropriate. So I setup a basic test setup on EC2 to simulate a multi-thousand machine environment.
The Loadtest
My primary tool to understand the system was Prometheus itself, as Prometheus is (unsurprisingly) instrumented with Prometheus metrics. In addition the Prometheus Go client provides a pile of process and Go-related metrics out of the box such as CPU usage and GC pause duration. I had a meta-Prometheus scraping the loaded Prometheus every second, and over the course of weeks of loadtesting built up a Grafana dashboard exposing the most relevant metrics.
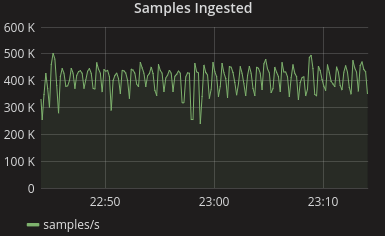
Spiky samples ingested/s
I quickly found things that were both surprising and undesirable. Primarily of concern was that the samples ingested wasn't even. Scrapes weren't being missed, however this was a sign of unhealthiness. While some non-uniformity would be expected on a small system, with the thousands of targets I was simulating it should have been almost perfectly flat.
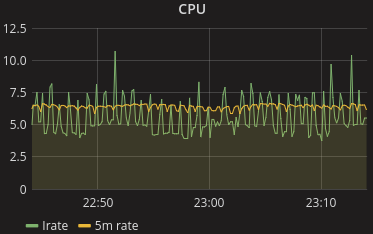
Prometheus CPU usage on an 8 core machine
I noticed there was a correlation with spiky CPU usage, which is also ungood. Spiky CPU usually means you need to provision for the peak CPU usage you see, which in this case was over 60% of the average CPU. Smoothing that out would help cut CPU requirements and reduce tail latency by quite a bit.
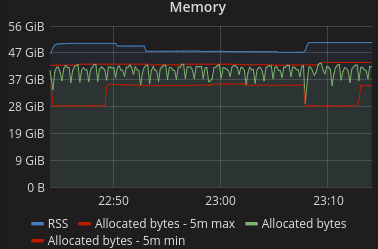
Sawtoothing memory usage
After false starts investigating various background maintenance processes, I realised this aligned with GC cycles.
Go Garbage Collection
At this point I need to stop and discuss how Go garbage collection works. Unlike Python's GC which uses reference counting or Java's GC which is generational mark-sweep, Go's GC is a relatively simple concurrent mark-sweep. Go keeps track of how much has been allocated, and once that reaches double what was left over after the previous GC run a sweep happens.
Sweeps mean pauses, which are famously brief in Go. The pauses themselves were not the problem here, typically taking under 1ms. If you dig through the Go source code you'll find this comment:
// It uses a feedback control algorithm to adjust the memstats.gc_trigger
// trigger based on the heap growth and GC CPU utilization each cycle.
// This algorithm optimizes for heap growth to match GOGC and for CPU
// utilization between assist and background marking to be 25% of
// GOMAXPROCS. The high-level design of this algorithm is documented
// at https://golang.org/s/go15gcpacing.
The above graphs are from a 8 core machine, thus GOMAXPROCS defaults to 8. 25% of that is 2 cores. 2 cores that can be suddenly be needed by the concurrent GC, and thus there's far less available CPU for processing than you'd expect. This indicated that the above test was probably starved for CPU - and indeed moving to a 16 core box resulted in a pretty flat ingestion rate.
Reducing Allocations
While it'd be nice to be able to throw more cores at the problem this isn't always practical. Hardware may not be available, and the user might not even be aware that this is a problem. You could also adjust GOGC to trade RAM for fewer bigger GC cycles, however that's not always sane given the RAM to CPU ratio of the machines you have available.
Thus we need to look at reducing the amount of garbage collection that is done, which means reducing the volume of allocations. Initial numbers indicated that Prometheus was allocating around 2kB per sample ingested.
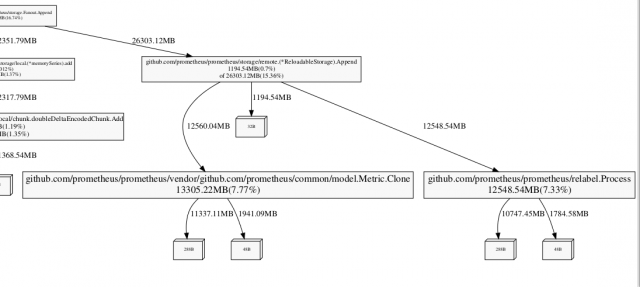
What's causing all these allocations? I could have dug through the code and figured out where all the memory was going from first principles, but a faster and much less error prone approach is to use a profiler. I previously looked at using pprof to see what's currently using memory in Prometheus. If you specify the -alloc_space flag then the total allocations since process start will be reported:
go tool pprof -alloc_space -svg :9090/debug/pprof/heap > heap.svg
Looking through this for places for improvement, I noticed metric cloning and relabelling taking a significant amount of allocations:
Relabelling was creating a copy of the metric at every invocation for simplicity, however the copy was only needed on one non-performance critical path so that was changed to only have that path do the copy. I thought the metric cloning allocations might have had to do with a call to make() missing a capacity, however that had no impact so I tweaked the code to skip the clone if it wasn't needed.
One challenge with iterating on such changes is that Prometheus does a lot of allocations at startup. It can easily take 20-30m for the normal ongoing allocations to become significant, let alone to approach their final proportions. I used two techniques to speed up iteration. The first was that I'd compare against another function's allocation on the same code path, but that I wasn't touching. Thus if my reference function was showing it was taking ~5% of allocations but it'd be ~20% in steady state, I could multiply the allocations in the function I cared about by 4x to get the right number without having to wait hours. The second technique was to look at the change in allocation rate. This is reported as go_memstats_alloc_bytes_total in binaries instrumented by the Prometheus Go client library, which ultimately comes from TotalAllocs in MemStats.
These small changes had the net effect of halving the allocations per sample down to around 1kB per sample ingested.
Being able to quickly bounce between pprof, Prometheus metrics and the source code was essential to making these improvements. Without all three it's unlikely I would have discovered these inefficiencies, let alone understand their impact.
The other takeaway is that Go GC adds 33% onto your required cores in non-batch usages, and over 100% onto your required RAM. Request Oriented Collector should improve upon this in future Go versions.
Want to utilise Prometheus in your loadtesting? Contact us.


No comments.