Ever wondered how Prometheus is using its memory? Let's find out!
Prometheus is linked with pprof, a Go profiling tool that makes it easy to look at CPU and memory usage. To use it against a local Prometheus server to investigate memory usage, ensure you have a working Go install and then run:
go tool pprof -svg :9090/debug/pprof/heap > heap.svg
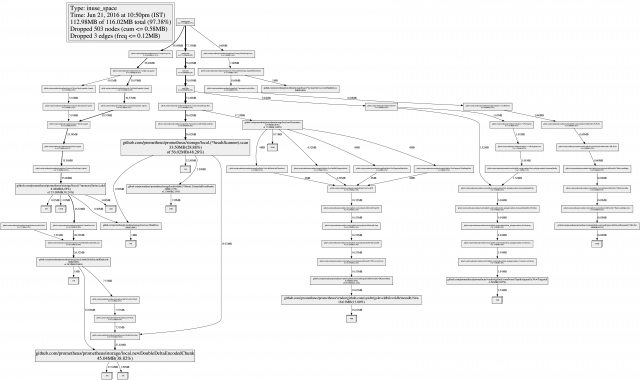
This will produce a SVG file that you can open in your web browser. Here's an example from a small Prometheus server:
local.newDoubleDeltaEncodedChunk in the bottom left here is memory used by samples, and will usually be the biggest memory user. The local.newPersistence subtree covers the metadata database.
There are metrics that are useful. process_resident_memory_bytes is the amount of memory the Prometheus process is using from the kernel, while go_memstats_alloc_bytes is how much Go is using from that. A large difference between these two could indicate spiky memory usage, or fragmentation issues.


No comments.