Cassandra is one of many Java-based systems that offers metrics via JMX. The JMX Exporter offers way to use these with Prometheus. By following these steps you can be up and running in under a minute!
We'll start from scratch, first we download and extract the latest Cassandra tarball:
wget http://archive.apache.org/dist/cassandra/2.2.4/apache-cassandra-2.2.4-bin.tar.gz
tar -xzf apache-cassandra-*-bin.tar.gz
cd apache-cassandra-*
We'll also need the JMX exporter java agent, configuration, and to tell Cassandra to use it:
wget https://repo1.maven.org/maven2/io/prometheus/jmx/jmx_prometheus_javaagent/0.3.0/jmx_prometheus_javaagent-0.3.0.jar
wget https://raw.githubusercontent.com/prometheus/jmx_exporter/master/example_configs/cassandra.yml
echo 'JVM_OPTS="$JVM_OPTS -javaagent:'$PWD/jmx_prometheus_javaagent-0.3.0.jar=7070:$PWD/cassandra.yml'"' >> conf/cassandra-env.sh
Now we can run Cassandra:
./bin/cassandra &
If you visit :7070/metrics you'll see the metrics.
Metrics alone aren't very useful, let's setup a quick Prometheus server:
wget https://github.com/prometheus/prometheus/releases/download/v2.0.0/prometheus-2.0.0.linux-amd64.tar.gz
tar -xzf prometheus-2.0.0.linux-amd64.tar.gz
cd prometheus-*
cat <<'EOF' > prometheus.yml
global:
 scrape_interval: 10s
 evaluation_interval: 10s
scrape_configs:
 - job_name: 'cassandra'
   static_configs:
    - targets:
      - localhost:7070
EOF
./prometheus
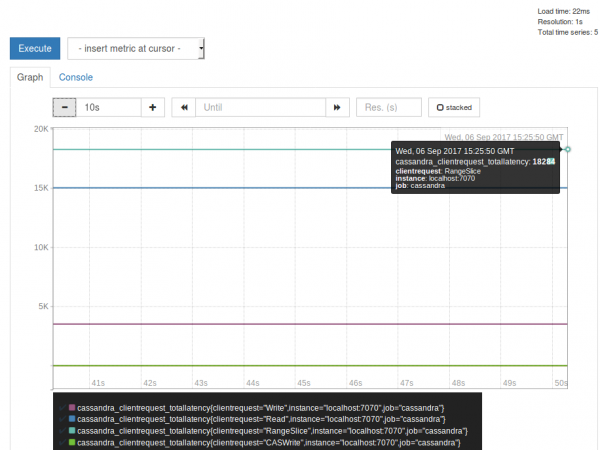
Wait half a minute to let Prometheus gather data and then you can access the data via the expression browser!


No comments.