
GC stats are one of the many metrics that the Java/JVM client library exposes.
Assuming that DefaultExports.initialize(); has been invoked, the Java client will expose a number of JVM metrics out of the box including memory pools, memory allocations, buffer pools, threads, JVM version, loaded classes, and of course garbage collection.
The GC information comes from GarbageCollectorMXBean, and is exposed as the jvm_gc_collection_seconds summary. In particular jvm_gc_collection_seconds_count for the number of GCs, and jvm_gc_collection_seconds_sum for how long they've all taken.
These are counters, so we can take a rate:
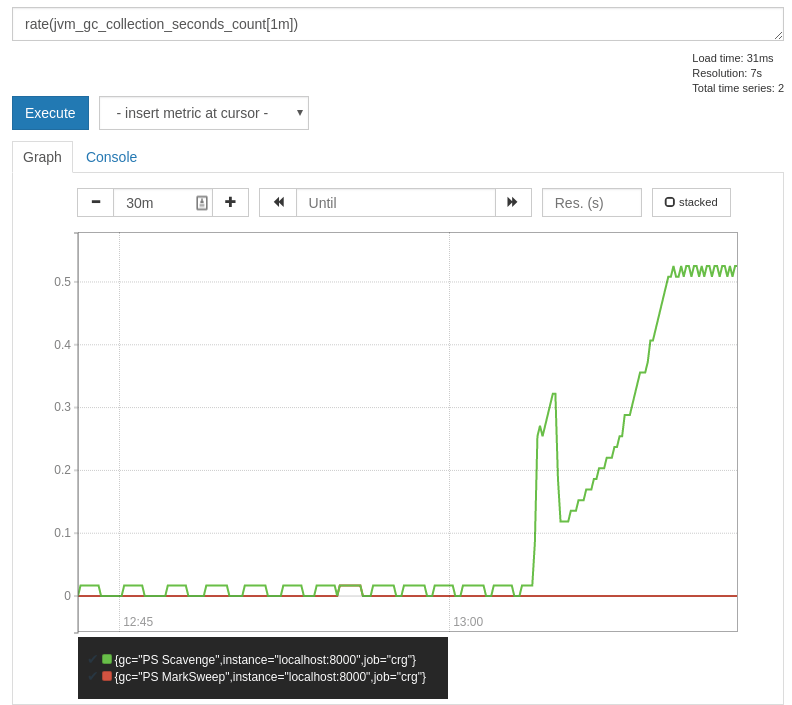
Here it seems PS Scavenge is happening once every 2 seconds or so, and PS MarkSweek is rare. You may ask which of those is the young generation and which the old/tenured, but this is not something the JVM exposes so you have to know which is which in your setup given the name.
A GC every 2 seconds sounds excessive, so let's check how long they're taking:
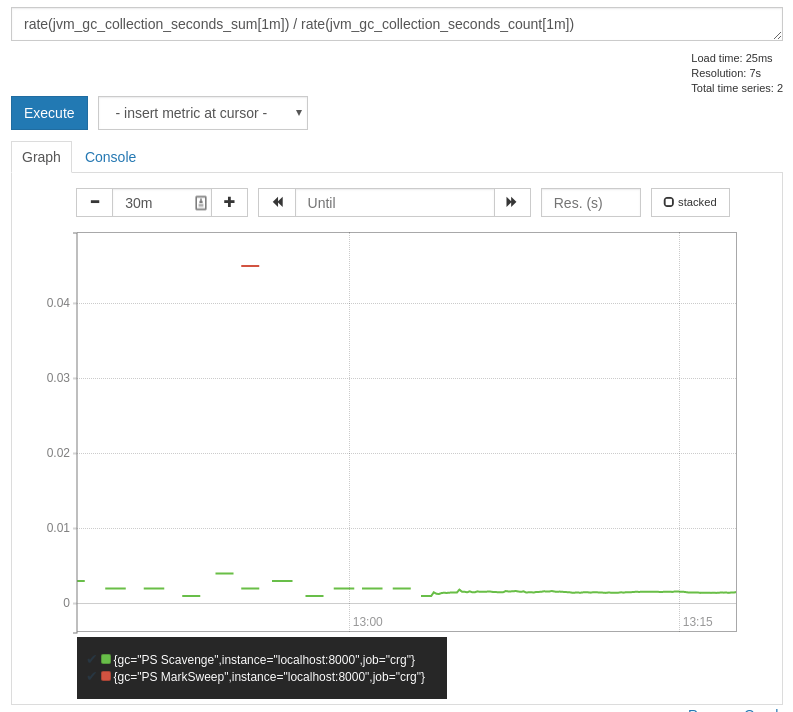
So they're only taking about 1.5ms on average, which is acceptable. The single PS MarkSweep took 45ms, but they're rare.
Finally using rate(jvm_gc_collection_seconds_sum[1m]) you can see what proportion of time each type of GC is taking up, which per the previous numbers is under 0.1% so not a concern at all.
Want to learn more about optimising Java applications? Contact us.


No comments.