
Prometheus 0.16.1 was just released, and with it brings my addition of the irate function. This offers more responsive graphs and higher resolution dashboards.
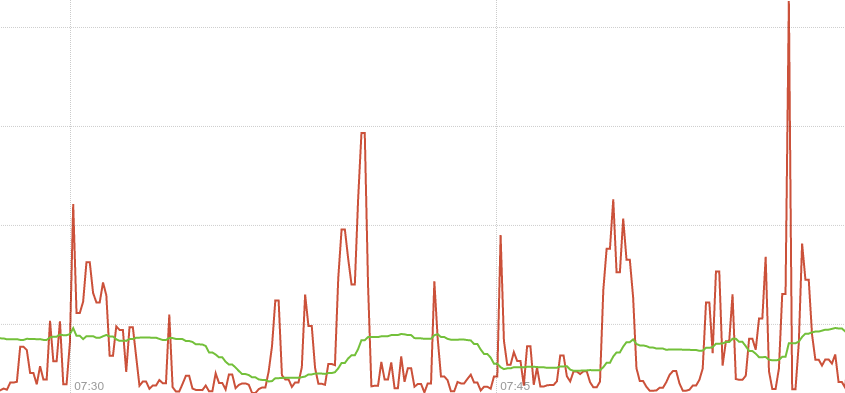
CPU usage on a machine. Red: irate(x[5m]). Green: rate(x[5m]).
rate function takes a time series over a time range, and based on the first and last data points within that range (allowing for counter resets) calculates a per-second rate. As it's based on the whole range, it's effectively an average rate over that range - 5 minutes in this case. You can see that the green line in the graph above is slow to pick up on changes, and not showing the full detail.
By contrast irate is an instant rate. It only looks at the last two points within the range passed to it and calculates a per-second rate. In the graph above the scrape interval is 10 seconds, so the red line is allowing you to see much briefer spikes and finer detail. This gives you better insight into what's really going on, taking advantage of the full resolution of the data available.
As with rate, irate is resilient to scrapes failing as it'll look back to the previous successful scrape. This loses a little resolution, but you don't miss any sudden changes around that failed scrape. This is one advantage of exporting raw counters over rates computed on the instrumented system.
Due to the instant rate being more responsive, there are a few things you should be aware of. If you're doing alerting based on irate a very brief dip could reset the alert's FOR clause, so prefer rate for alerting. In graphs over long time periods used for trending, full resolution data can be distracting so the implicit averaging of rate is more useful.
If irate only looks at the last two points, why do we pass it a much longer period than that? The answer is that you want to limit how far back it'll look to find those two points, as you don't want to inadvertently use data from hours ago. This also has the benefit that dashboards no longer need to consider all potential scrape intervals when choosing the rate range, often leading to averaging over a much longer period than is needed. With the instant rate if scrapes become more frequent, graphs automatically improve in resolution!


No comments.