
Among the many integrations for Prometheus is the Cloudwatch exporter.
First off to access Cloudwatch we need premissions, so setup an IAM user with the CloudWatchReadOnlyAccess policy. There's a few ways to provide the credentials, one is to use credential profile files:
$ aws configure
AWS Access Key ID [********************]: enter_your_access_key_here
AWS Secret Access Key [********************]: enter_your_secret_key_here
Default region name [eu-west-1]:
Default output format [None]:
We can now download and run the exporter:
wget https://repo1.maven.org/maven2/io/prometheus/cloudwatch/cloudwatch_exporter/0.6.0/cloudwatch_exporter-0.6.0-jar-with-dependencies.jar
wget https://raw.githubusercontent.com/prometheus/cloudwatch_exporter/cbe73e796998012504485bc3f01298b6403d4615/example.yml
java -jar cloudwatch_exporter-0.6.0-jar-with-dependencies.jar 1234 example.yml
This is using example configuration file, which looks at the eu-west-1 region out of the box so adjust as needed. If you visit :1234/metrics you will see some metrics, presuming you are using one of the services covered by the example config. cloudwatch_exporter_scrape_error being 0 indicates that the scrape was successful:
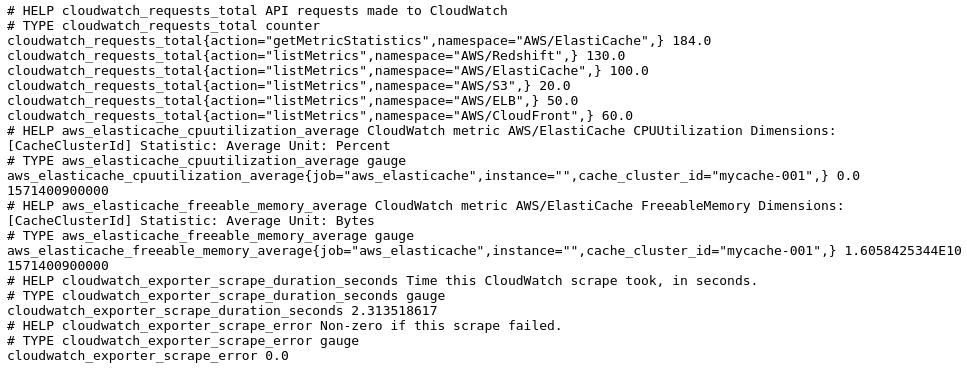
An important thing to note here is the timestamps that are exposed on the Cloudwatch metrics. Timestamps are not something that an exporter should typically expose, as scrapes should be synchronous. The particular issue with Cloudwatch is that it is a monitoring system and it has been observed to take up to 10 minutes for values to converge, and as Prometheus has an append-only database this means we have to request 10 minute old data. Exposing that with no timestamp would have data be off by 10 minutes which would be misleading, as that's a bit much to get away with. Aside from the usual issues with exposed timestamps such as staleness not working, this also means that recording rules/alerts won't pick up the values. You can add an offset 10m to the vector selector to access the values, or specify set_timestamp: false in the Cloudwatch exporter configuration file on a per-metric basis.
Scraping the Cloudwatch exporter from Prometheus is mostly standard:
scrape_configs:
 - job_name: cloudwatch
   honor_labels: true
   static_configs:
    - targets: ['localhost:1234']
honor_labels is used here so that the metrics from Cloudwatch don't end up with the instance label of the exporter.
There are several disadvantages to Cloudwatch, One issue is cost, every API request that the Cloudwatch exporter makes to Cloudwatch costs $0.00001 which can add up surprisingly quickly with regular scrapes. The cloudwatch_requests_total metric helps you track this. Getting data from Cloudwatch can also be relatively slow, so limit what you pull in. Another is the data model, rather than exposing a 0 Cloudwatch will often not expose a result at all which (as with Prometheus generally) can be tricky to deal with. Determining which statistic you want for a given metric can be tricky, and not all metrics have all potential combinations of dimensions available. Some Dynamo metrics have different semantics depending on which dimensions are specified, deviating from the Cloudwatch data model (don't worry, the Cloudwatch exporter has a hard-coded workaround for this). Some metrics such as those for S3 are only provided once a day, so range_seconds and period_seconds need adjusting to pick them up.
So overall I'd recommend using Cloudwatch only where you don't have any other choice such as for ELB metrics. For things like EC2 instance metrics prefer the Node exporter instead, it's cheaper and will give you far more information. Historically Cloudwatch only retained 2 weeks of history, these days it's 15 months so there's no real need to transfer the data into a another monitoring system like Prometheus just to preserve it. If you only need graphing, you might consider Grafana's Cloudwatch data source. For simple alerting Cloudwatch's own alarms can suffice, and there is a basic expression language these days.
Want to integrate other monitoring systems with Prometheus? Contact us.


No comments.