
Ever wanted more information about Blackbox probe failures?
There are three different ways to get debugging information from the Blackbox exporter.
The first is to add &debug=true to the probe URL, for example :9115/probe?module=http_2xx&target=https://www.prometheus.io/&debug=true. This will not produce metrics, but rather detailed debug information:
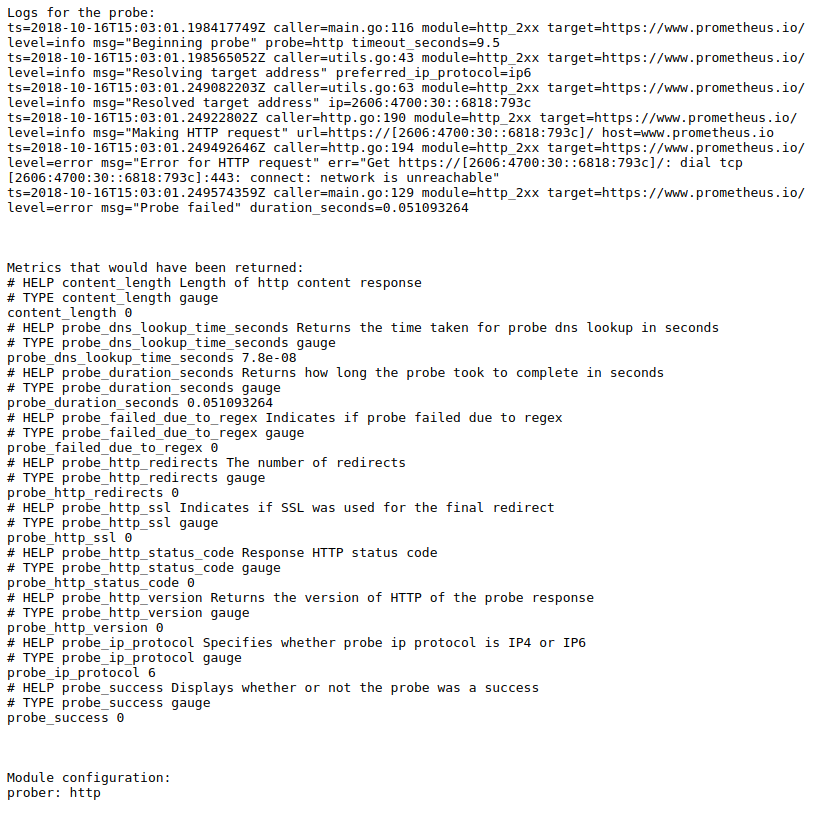
There's three parts. The first are the logs, the second are the metrics, and the third is the configuration of the module that was used. Here the error is level=error msg="Error for HTTP request" err="Get https://[2606:4700:30::6818:783c]/: dial tcp [2606:4700:30::6818:783c]:443: connect: network is unreachable", indicating that connecting over IPv6 isn't working. This method is useful when a probe is consistently failing.
The second place debug logs are accessible is the landing page of the exporter, on :9115/. There will be a list of the most recent probes and a link to get the above debug output for that probe:
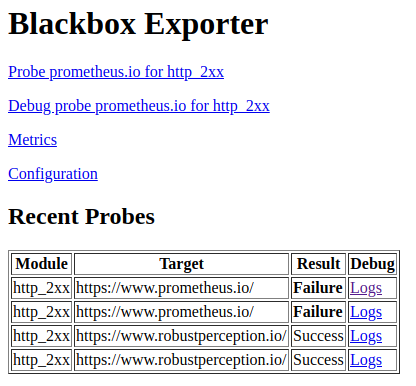
This is useful if you don't have a high volume of probes.
The third and final place you can access the debug logs is in the logs of the Blackbox exporter. You can enable this by passing --log.level=debug as a command line flag to the Blackbox exporter. This is useful if you have a high volume of probes and an intermittent probe failure.
Want to know more about blackbox monitoring? Contact us.


No comments.