
While Prometheus' local storage provides us with a simple storage setup it is limited to the amount of data that can fit on one machine.
Recently several long term storage options for Prometheus have come on the scene. In this blogpost we'll look at setting up the CrateDB Prometheus Adapter, which we developed on behalf of CrateDB. It will accept Prometheus remote read/write requests, and send them to be stored in CrateDB.
Begin by downloading and running CrateDB: (note CrateDB v2.2 is required!)
wget https://cdn.crate.io/downloads/releases/crate-2.2.0.tar.gz
tar -xzf crate-2.2.0.tar.gz
cd crate-2.2.0/bin
./crate
This will download, install and start the CrateDB service on your local machine at port 4200.
Next we'll create the following table in our CrateDB:
(You can paste snippet below into the CrateDB console over at localhost:4200/#/console)
CREATE TABLE "metrics" (
  "timestamp" TIMESTAMP,
  "labels_hash" STRING,
  "labels" OBJECT(DYNAMIC),
  "value" DOUBLE,
  "valueRaw" LONG,
  PRIMARY KEY ("timestamp", "labels_hash")
);
Next download and build the CrateDB Prometheus Adapter:
go get github.com/crate/crate_adapter
cd ${GOPATH-$HOME/go}/src/github.com/crate/crate_adapter
go build
./crate_adapter
The adapter will listen on port 9268 bey default, and talk to the local CrateDB running on port 4200. This is configurable via command line flags, which you can see by passing the -h flag.
Finally we'll download and run Prometheus, configuring its remote read and write paths to talk to the adapter, and for it to scrape itself so we'll have some metrics to play with:
wget https://github.com/prometheus/prometheus/releases/download/v2.0.0/prometheus-2.0.0.linux-amd64.tar.gz
tar -xzf prometheus-*.linux-amd64.tar.gz
cd prometheus-*
cat > prometheus.yml << EOF
global:
   scrape_interval: 5s
scrape_configs:
  - job_name: prometheus
    static_configs:
      - targets: ["localhost:9090"]
remote_write:
   - url: :9268/write
remote_read:
   - url: :9268/read
EOF
./prometheus
Prometheus should now start writing samples to CrateDB!
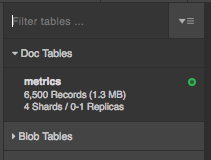
Head over to :4200/#/tables/doc/metrics and you should see something like the following in the top left hand corner of the screen which indicates that Prometheus is writing successfully to CrateDB:
We can also verify this by heading over to the CrateDB console and querying for our metrics:

If we were to stop Prometheus, wipe its storage and start it back up again we'd still have seamless access to our data!
Need help with Prometheus and long term storage? Contact us.


No comments.