
Grafana recently added support for Prometheus. Let's take a look at how to get it up and running.
First let's setup a quick Prometheus server to scrape itself so we have some metrics to play with:
wget https://github.com/prometheus/prometheus/releases/download/v2.0.0/prometheus-2.0.0.linux-amd64.tar.gz
tar -xzf prometheus-2.0.0.linux-amd64.tar.gz
cd prometheus-*
cat <<'EOF' > prometheus.yml
global:
 scrape_interval: 10s
 evaluation_interval: 10s
scrape_configs:
 - job_name: 'prometheus'
   static_configs:
    - targets:
      - localhost:9090
EOF
./prometheus &
Next let's get Grafana up and running:
wget https://grafanarel.s3.amazonaws.com/builds/grafana-latest.linux-x64.tar.gz
tar -xzf grafana-latest.linux-x64.tar.gz
cd grafana-*
./bin/grafana-server &
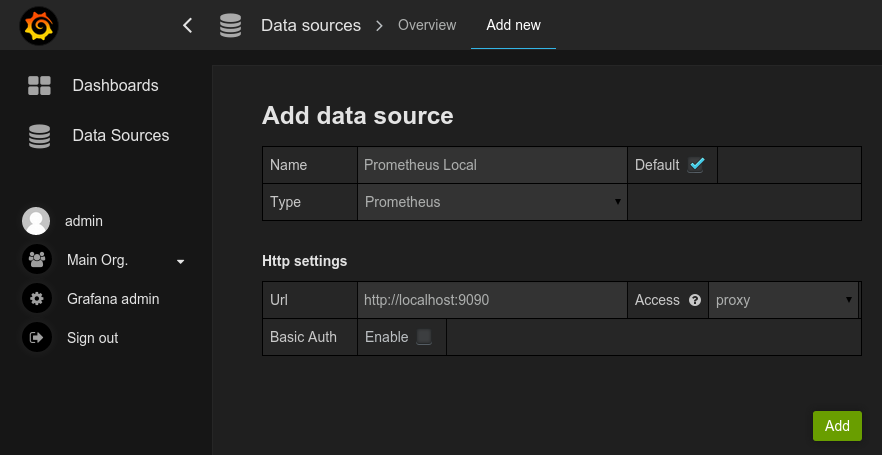
Adding Prometheus Data Source
- Go to :3000
- Enter the username
adminand passwordadmin, and then click "Log In". - Click "Data Sources" on the left menu
- Click "Add new" on the top menu
- Add a default data source of type
Prometheuswith:9090as the URL
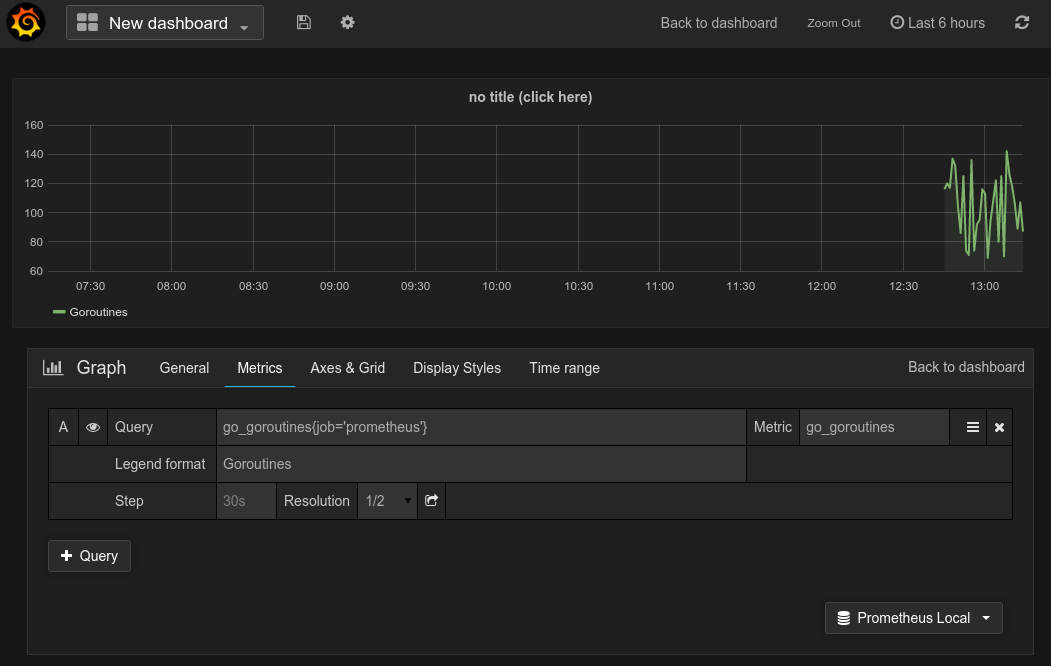
Adding a Dashboard
- Click "Dashboards" on the left menu
- Click "Home" on the top menu, and then "+ New" at the bottom of the panel that appears
- Click the "Graph" box that appears underneath "New Dashboard" in the top left hand side of the screen to add a new graph panel
- Click on "Panel Title" and then "Edit" in the small box that appears above
- Enter
go_goroutines{job='prometheus'}in the "Query" field - Click the eye symbol on the right hand side of screen to see your graph
- Click the floppy disk icon on the top menu to save your dashboard
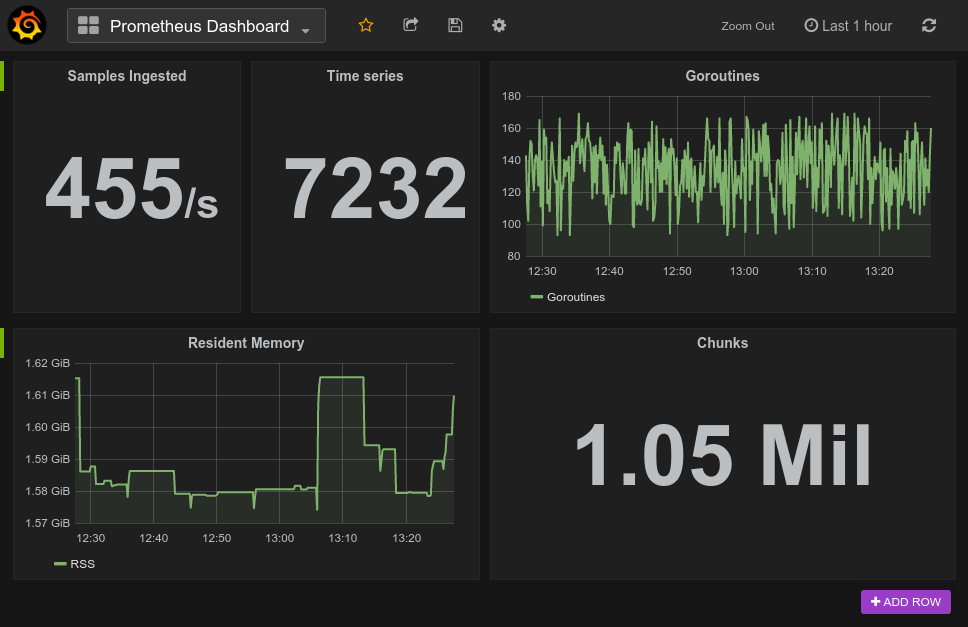
Adding a Dashboard of Goroutines
You can use any Prometheus expression in a query, plot multiple expressions and much more. Now that you're up and running go explore more of what's possible with Prometheus and Grafana!


No comments.