
Sometimes you need a machine metric that's not exported yet by the node exporter. The textfile collector can be used to quickly get such metrics graphed in Prometheus.
One of my computers was randomly getting turned off. Looking through the logs wasn't fruitful, and as it has always run a bit hot I suspected thermal issues. The node exporter doesn't yet export metrics related to temperature, fans and voltage so that's not something Prometheus can provide out of the box. In addition every motherboard tends to have a different layout, but in this case I only care about one machine so I can do a hack for just this one machine. Using the sensors command I can get:
atk0110-acpi-0
Adapter: ACPI interface
Vcore Voltage: +1.12 V (min = +0.85 V, max = +1.60 V)
 +3.3 Voltage: +3.29 V (min = +2.97 V, max = +3.63 V)
 +5 Voltage: +4.92 V (min = +4.50 V, max = +5.50 V)
 +12 Voltage: +12.05 V (min = +10.20 V, max = +13.80 V)
CPU FAN Speed: 0 RPM (min = 600 RPM)
CHASSIS FAN Speed: 0 RPM (min = 600 RPM)
CPU Temperature: +94.0°C (high = +60.0°C, crit = +95.0°C)
GPU Temperature: +89.0°C (high = +60.0°C, crit = +95.0°C)
A little bit of sed produces output that's compatible with the Prometheus text output format:
$ sensors | sed -ne 's/\..*//; s/ /_/; s/: *+/ /; /Temp/p'
CPU_Temperature 94
GPU_Temperature 89
Finally this can be put in a crontab to run every minute, with a little code to ensure atomicity:
* * * * * sensors | sed -ne 's/\..*//; s/ /_/; s/: *+/ /; /Temp/p' > /var/lib/node_exporter/textfile_collector/lmsensors.prom.$$ && mv /var/lib/node_exporter/textfile_collector/lmsensors.prom.$$ /var/lib/node_exporter/textfile_collector/lmsensors.prom
/var/lib/node_exporter/textfile_collector/ is the default location for the textfile collector to look at for node exporter Debian packages from deb.robustperception.io.
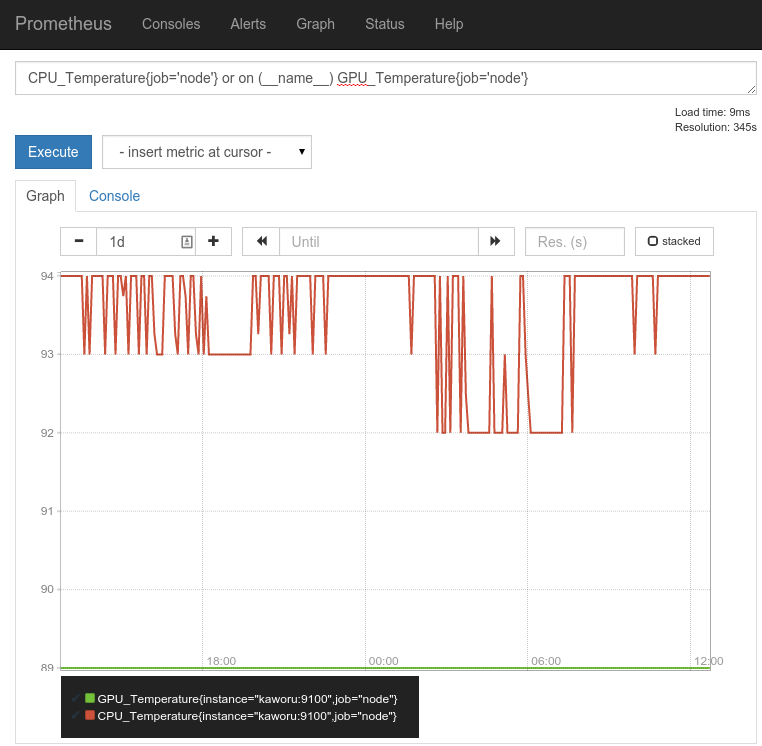
Temperature graphs for a machine
The next time it turns off, I'll be able to check this graph to see if there was a temperature spike beforehand.


No comments.