
Ever wanted to use Prometheus for monitoring and alerting on the OpenShift platform?
In this blogpost we'll be looking at how to setup Prometheus and use it to scrape the metrics of another service deployed using OpenShift and Docker on a local machine.
For this simple example, we'll be using Google's cAdvisor to export the metrics that Prometheus will be scraping from.
In order to do this we'll be using the OpenShift command line tool, oc, which is available for all major operating systems on OpenShift's website.
For the sake of brevity, I'll assume you already have Docker installed and the daemon running on your machine. Note that you'll have to launch the Docker daemon with the following argument --insecure-registry 172.30.0.0/16
Once everything is installed, fire up your favourite terminal application and use the following command to start up a local OpenShift all-in-one cluster.
oc cluster up
With the cluster up you'll then need to login to the OpenShift platform that is now running on your machine.
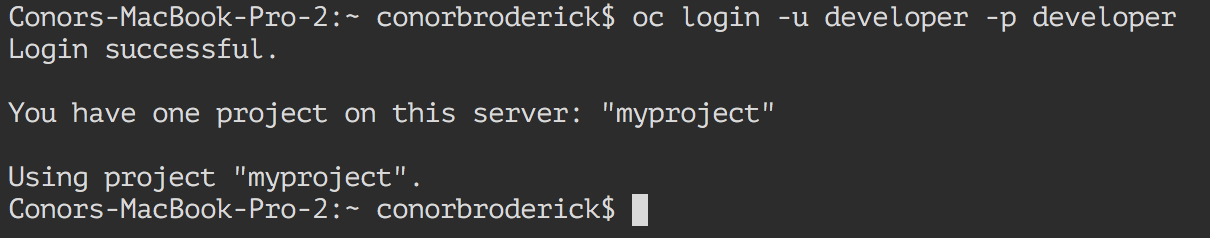
oc login -u developer -p developer
You should now see a message stating that you have logged in successfully.
Let's create a new empty project with the following command:
oc new-project prometheus-example
Next we'll need to deploy the existing Docker images for both cAdvisor and Prometheus to the OpenShift platform.
To do this enter the following two commands to pull the images for cAdvisor and Prometheus from the public Docker Hub registry.
oc new-app google/cadvisor
oc new-app prom/prometheus
This will store the two images in the OpenShift registry on our machine and create Kubernetes objects for the images, deploying each of them inside of their own pods.
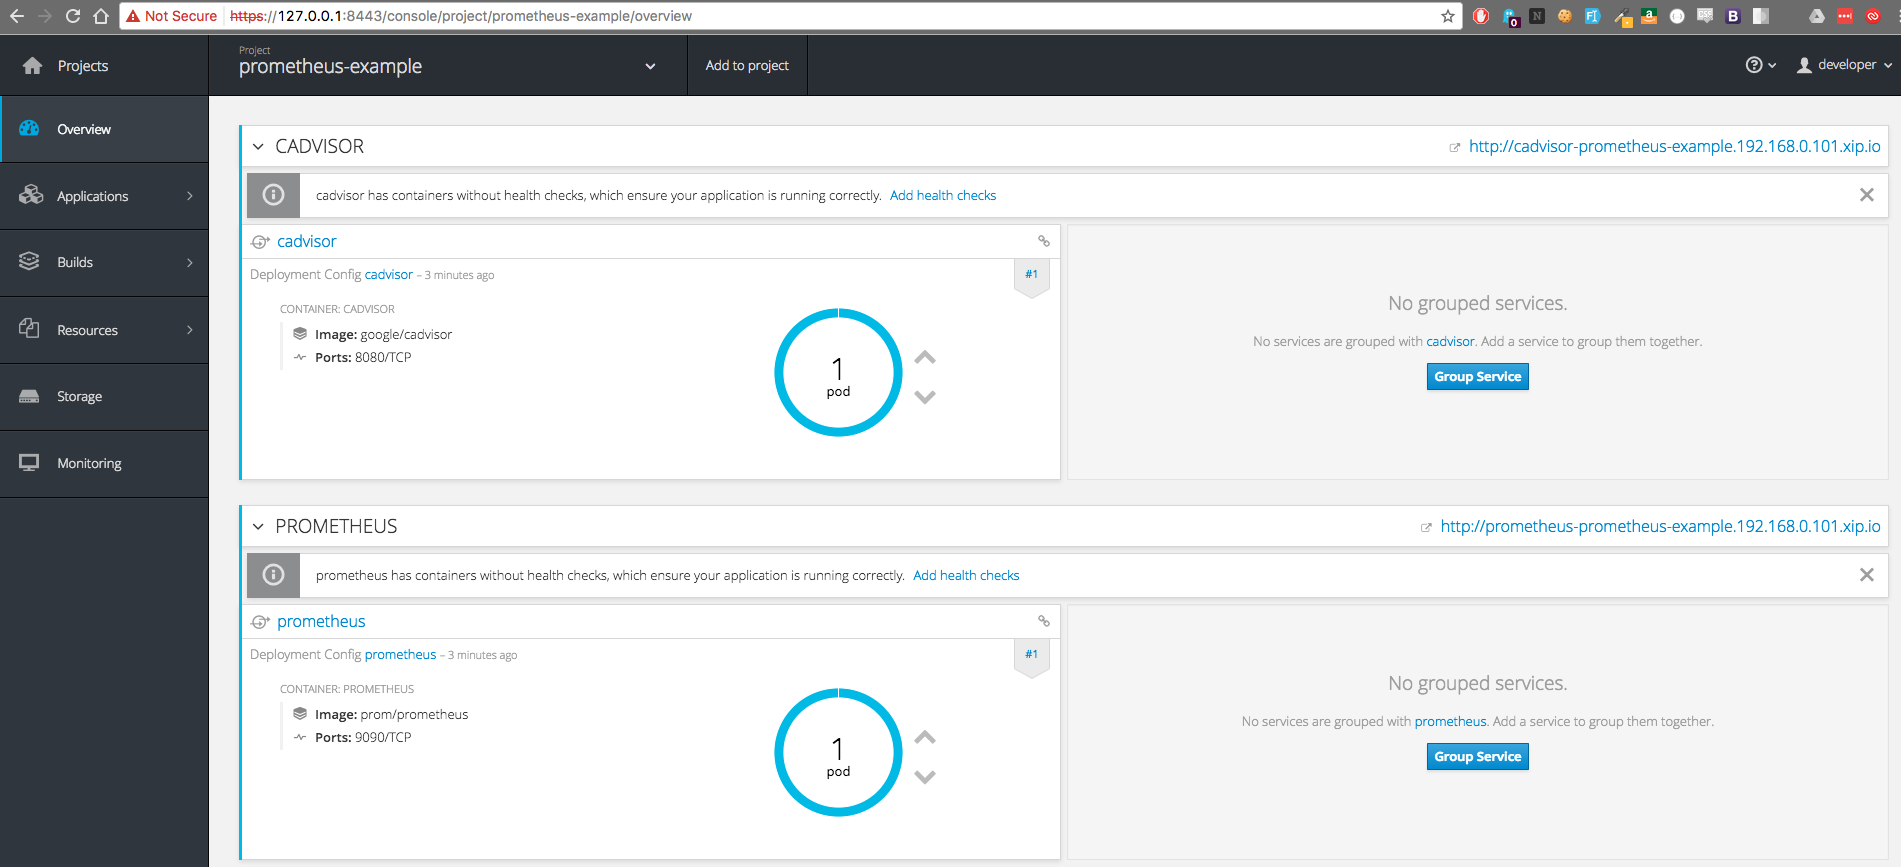
If we head over to our OpenShift console, login (u:developer, p:developer), and click on our prometheus-example project - we should see our two applications successfully deployed. Note that it may take a moment or two for them to spin up completely!
We now need to setup routes to these pods so that they are accessible on the network. Do this by running the two commands below.
oc expose service cadvisor
oc expose service prometheus
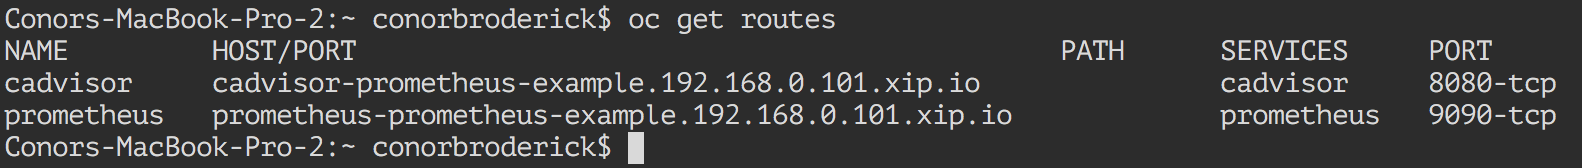
Two routes have now been created to each of the deployed applications. The URLs for each can be seen from the Web UI console page above or from the following command:
oc get routes
This will produce a list of your routes and the URL you can use in your browser to reach them.
Before we start scraping metrics from the now deployed cAdvisor instance, we need to configure Prometheus.
In order to keep the image and configuration decoupled, we'll be using the ConfigMap object to inject our Prometheus deployment with the appropriate configuration data.
Let's create the configuration file and use it to create the desired ConfigMap.
cat <<'EOF' > prometheus.yml
global:
  scrape_interval:     5s
  evaluation_interval: 5s

scrape_configs:
  - job_name: 'prometheus'
    static_configs:
      - targets: ['localhost:9090']

  - job_name: 'cadvisor'
    static_configs:
      - targets: ['cadvisor:8080']
EOF

oc create configmap prom-config-example --from-file=prometheus.yml
Next we'll need to edit the deployment configuration for Prometheus to include this ConfigMap.
oc edit dc/prometheus
There's two parts we need to add in here.
The first is a new volume name with our ConfigMap and the second is the volumeMount which will give the path of where the prometheus.yml file will be.
First let's add the new volume:
57 58 59 60 |
- name: prom-config-example-volume configMap: name: prom-config-example defaultMode: 420 |
Now we'll add the new volumeMount:
72 73 |
- name: prom-config-example-volume mountPath: /etc/prometheus/ |
Here's a gist of my config file in case you would like to take a closer look.
The following ConfigMap you just created and added to your deployment will now result in the prometheus.yml file being generated at /etc/prometheus/ with the contents of the file config file we generated on our machine earlier.
This configuration will configure Prometheus to scrape both itself and the metrics generated by cAdvsisor.
Head over to your running Prometheus instance on OpenShift and execute the up PromQL query in the Expression browser to see if everything is setup correctly.
You should see two results returned to the console representing the Prometheus and cAdvisor instances, each with a value of 1 indicating that they're running and successfully being scraped by Prometheus itself.
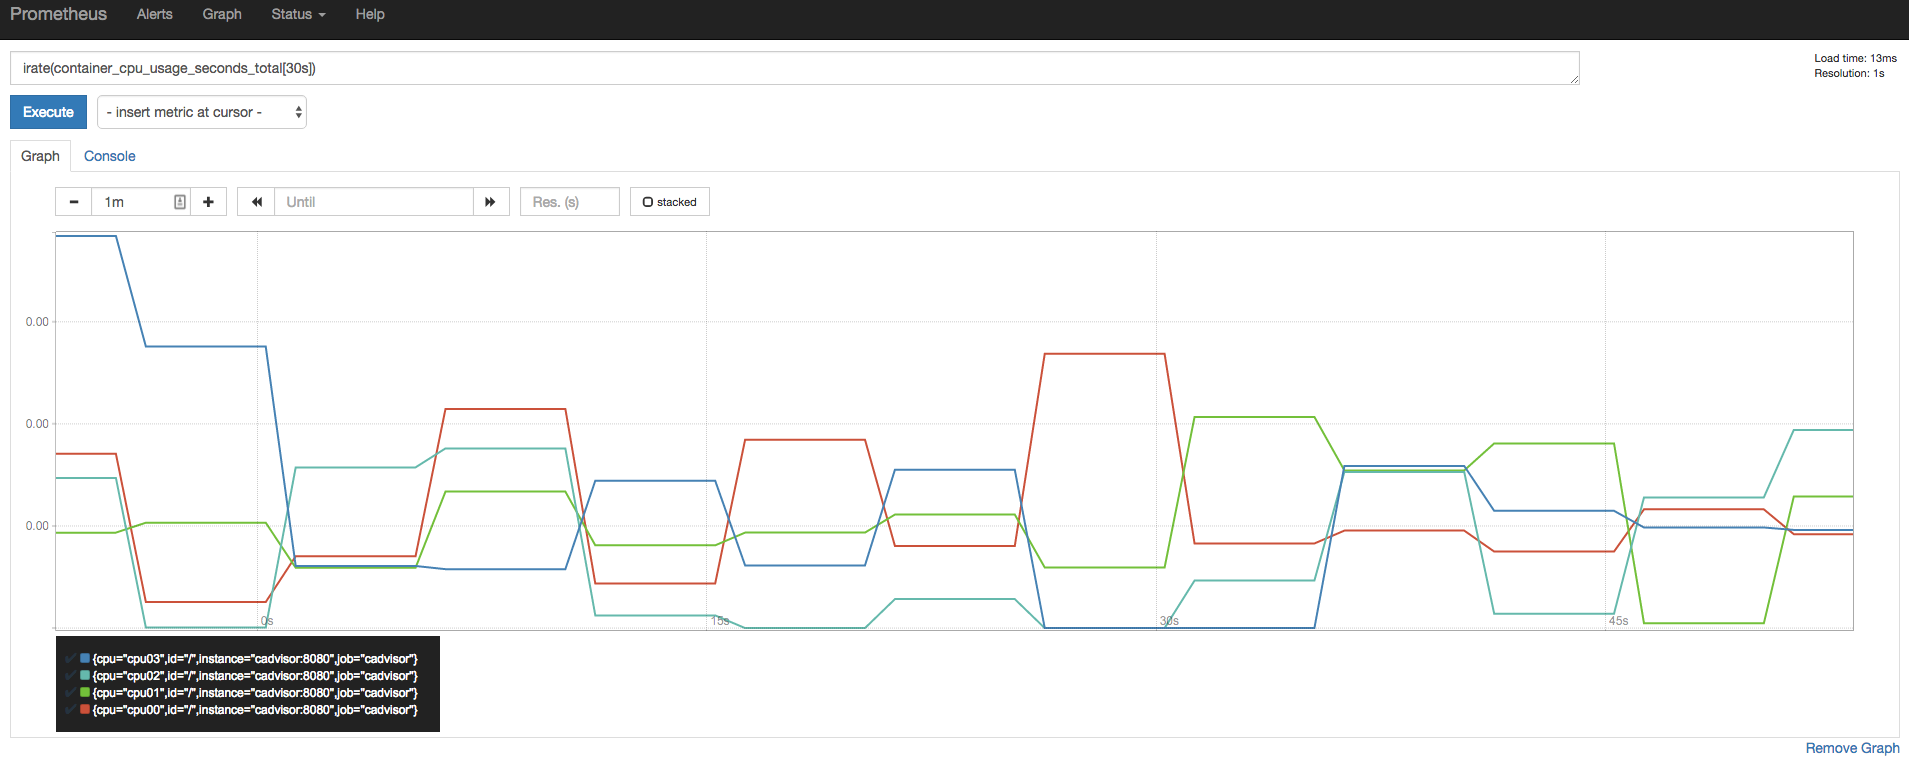
For something a little more interesting, let's take a look at the container_cpu_system_seconds_total metric which when entered into the Expression browser will produce a time series of the cumulative system cpu time consumed in seconds over time.
In the graph below, I've used the PromQL rate() method to calculate the per-second average rate of increase of the time series in the range vector.
rate(container_cpu_system_seconds_total[5m])
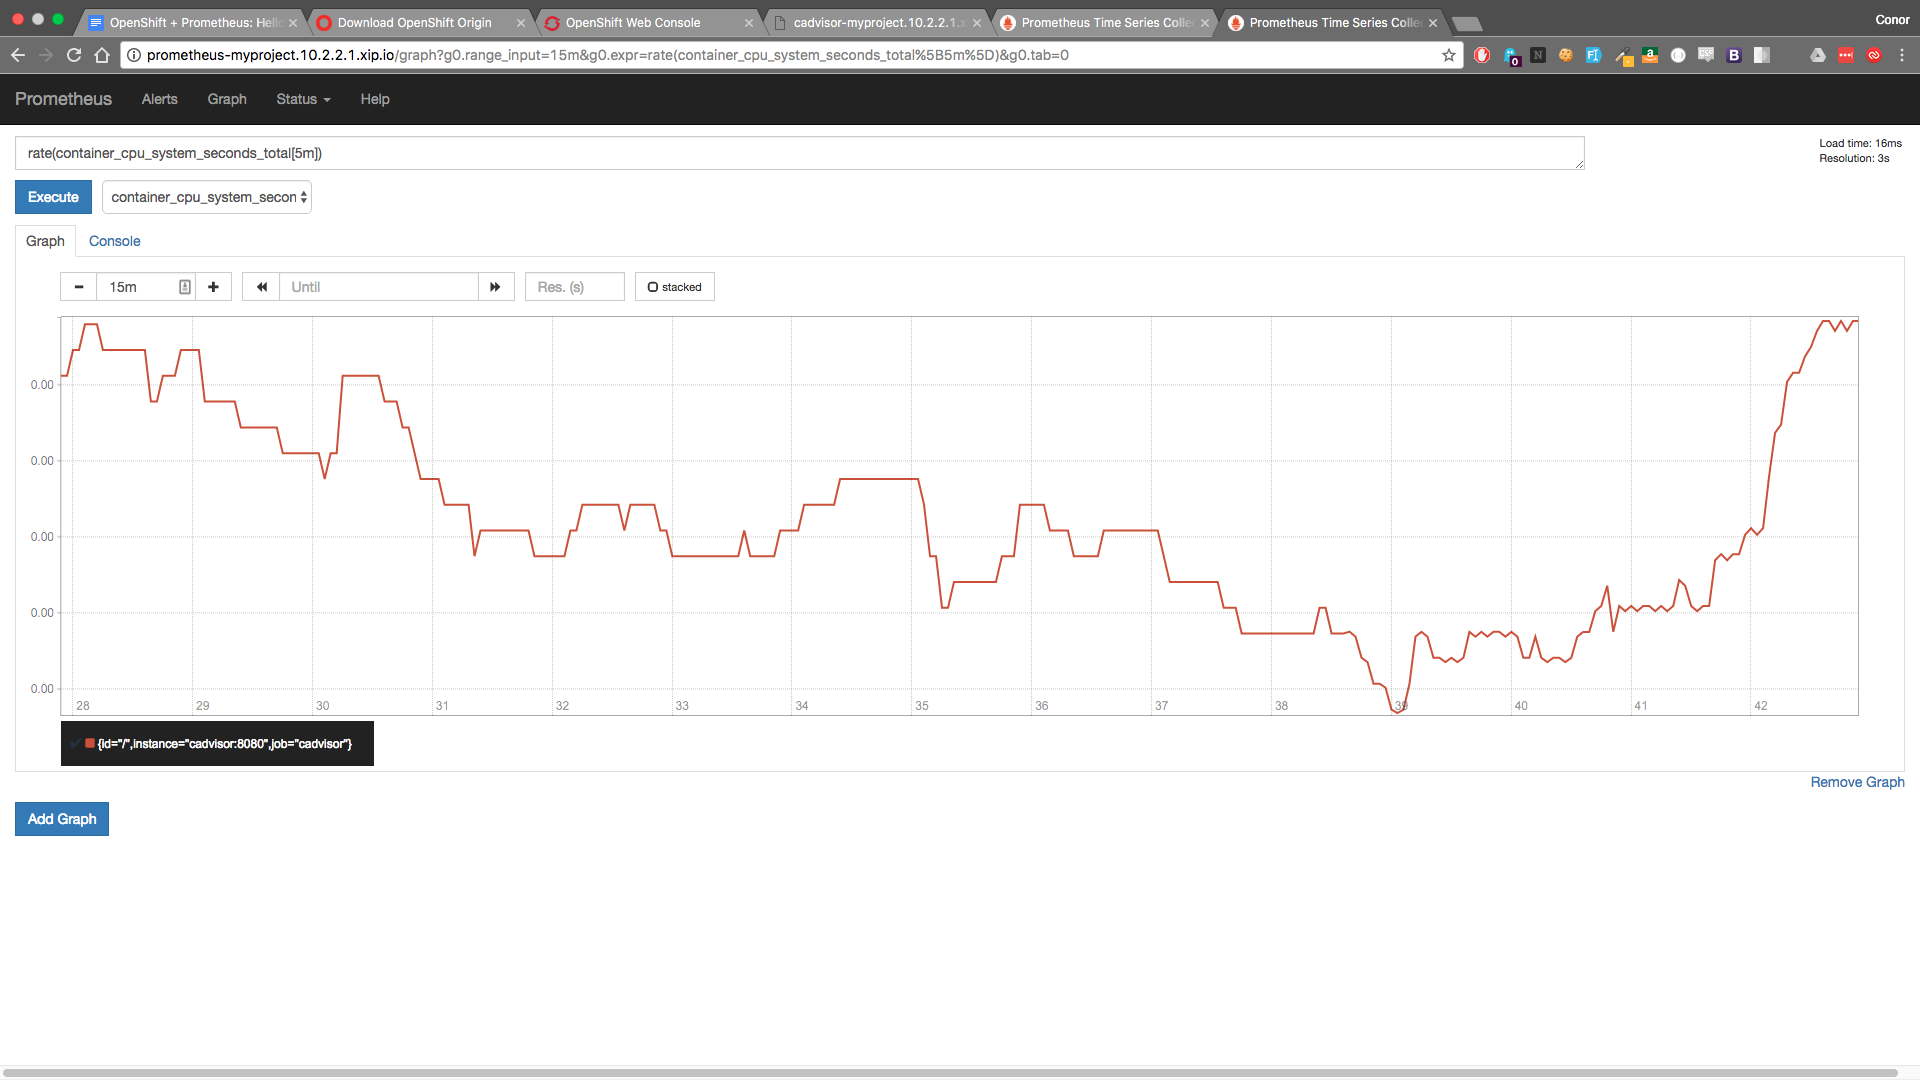
Note that as this is just a quick demo, we've manually set our targets for Prometheus to scrape. In reality you would use Kubernetes service discovery to locate the cAdvisor service.
Want to learn more about monitoring with Prometheus on OpenShift? Contact us.


No comments.