
Switching to Prometheus for monitoring but still have older Nagios checks you're not quite ready to let go of just yet? Now you can monitor and alert on Nagios checks with the nrpe_exporter!
Note: version 2.15 of the Nagios NRPE server was used in this blogpost. Other versions may or may not work.
This blogpost explores using the Prometheus nrpe_exporter to expose metrics on NRPE commands to a running NRPE daemon and ingest them into Prometheus itself.
To achieve this we'll be using the nrpe_exporter which exposes metrics on NRPE commands. This allows us to see if the checks succeeded or failed, what their status is, and how long they took to complete.
In order to demonstrate its use, we'll setup a locally running Nagios NRPE server on our local machine that our exporter can talk to and export metrics from for a Prometheus to scrape.
Begin by installing the Nagios NRPE server:
sudo apt-get update
sudo apt-get install nagios-nrpe-server
Next we need to add our local host as an allowed host for the NRPE server:
cd /etc/nagios
Edit the nrpe_local.cfg file:
sudo vim nrpe_local.cfg
Add the line:
allowed_hosts=127.0.0.1
Your nrpe_local.cfg will look something like this:
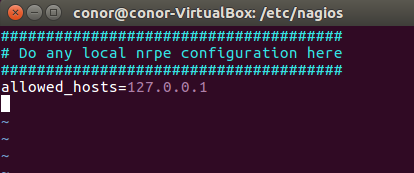
As this version of the nrpe_exporter does not support SSL we need to disable it on the server:
cd /etc/default
Now edit the nagios-nrpe-server file:
sudo vim nagios-nrpe-server
Uncomment the following on line 5:
DAEMON_OPTS="--no-ssl"
It should look like this (click image to enlarge):

We can now start the Nagios NRPE server:
cd /etc/init.d
./nagios-nrpe-server start
./nagios-nrpe-server restart
Next we'll download and run the nrpe_exporter:
wget https://github.com/RobustPerception/nrpe_exporter/releases/download/0.1.0/nrpe_exporter-0.1.0.linux-amd64.tar.gz
tar -xzf nrpe_exporter-0.1.0.linux-amd64.tar.gz
cd nrpe_exporter-*
./nrpe_exporter
Visit :9275/export?command=check_load&target=127.0.0.1:5666 and you should see the metrics for the command check_load against your Nagios NRPE server:
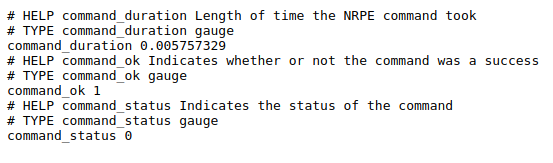
Your nrpe_exporter is now successfully querying the running NRPE server on your machine and exposing metrics about it.
Next we'll download, run, and configure a Prometheus server to ingest the metrics from the nrpe_exporter:
wget https://github.com/prometheus/prometheus/releases/download/v2.0.0/prometheus-2.0.0.linux-amd64.tar.gz
tar -xzf prometheus-2.0.0.linux-amd64.tar.gz
cd prometheus-*
cat > prometheus.yml << EOF
global:
  scrape_interval: 10s
scrape_configs:
  - job_name: nrpe
    metrics_path: /export
    params:
      command: [check_load] # Run the check_load command.
    static_configs:
      - targets: # Targets to run the specified command against.
        - '127.0.0.1:5666'
    relabel_configs:
      - source_labels: [__address__]
        target_label: __param_target
      - source_labels: [__param_target]
        target_label: instance
      - target_label: __address__
        replacement: 127.0.0.1:9275 # Nrpe exporter.
EOF
./prometheus
Heading over to our locally running Prometheus and keying in the query command_ok into the expression browser and shrinking the time range to 1 second, we should see the following (click image to enlarge):

We've now configured our Prometheus instance to periodically tell the nrpe_exporter to query the NRPE server with the command check_load against the specified target 127.0.0.1:5666 where our NRPE daemon resides every 5 seconds, expose metrics based on the response, expose them to Prometheus to ingest, and finally graph them.
You could now setup and configure Prometheus to alert on these metrics coming from the nrpe_exporter and send notifications via email/PagerDuty/Slack etc. using the Alertmanager.
The status and results of all of your Nagios commands can now be alerted on with Prometheus!
I've setup a Grafana dashboard which you can download here listing the number of passed and failed checks:

Need Prometheus and Nagios advice? Contact us.


No comments.