
In this blogpost we'll run you through a quick 'hello world' example instrumenting a Rails application with the Prometheus ruby client.
(The completed sample created in this blogpost can be found here.)
Create a new rails application:
$ rails new prom-example
Add the Prometheus client and rack gems to your Gemfile and install all of the required gems:
...
gem 'prometheus-client'
$ bundle
Next we'll add the two Rack middlewares required by the Prometheus ruby client.
One is used to expose the metrics HTTP endpoint to be scraped by a Prometheus server while the other is used to trace all of the HTTP requests.
Replace your config.ru file with the following:
# config.ru
require_relative 'config/environment'
require 'prometheus/middleware/collector'
require 'prometheus/middleware/exporter'

use Prometheus::Middleware::Collector
use Prometheus::Middleware::Exporter

run Rails.application
Now spin up your rails application and head over to :3000/metrics
$ rails s
You should see the following default metrics displayed in your browser window:
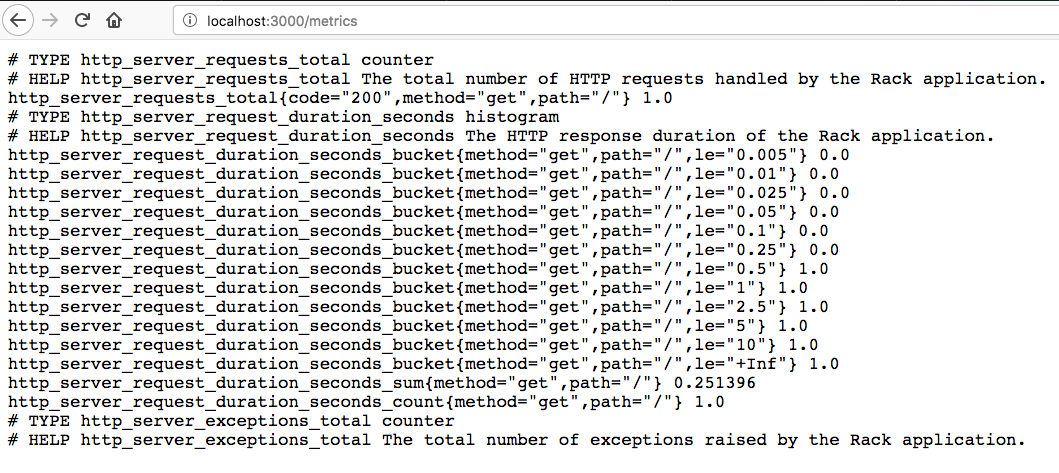
Even with the default metrics provided by the client we are able to measure the latency of our application with the follownig PromQL expression:
  rate(http_server_request_duration_seconds_sum{status="200", path="/"}[1m])
/
  rate(http_server_request_duration_seconds_count{status="200", path="/"}[1m])
Next we'll define some of our own metrics in our simple rails application to be exported.
To keep things modular, we'll define and keep our Prometheus registry and metrics inside of the /lib directory where extended modules for our application are kept.
Inside of /lib create the following file structure:
/lib
    /prometheus
        controller.rb
prometheus.rb
# /lib/prometheus.rb
module Prometheus; end
# /lib/prometheus/controller.rb

module Prometheus
  module Controller

    # Create a default Prometheus registry for our metrics.
    prometheus = Prometheus::Client.registry

    # Create a simple gauge metric.
    GAUGE_EXAMPLE = Prometheus::Client::Gauge.new(:gauge_example, 'A simple gauge that rands between 1 and 100 inclusively.')

    # Register GAUGE_EXAMPLE with the registry we previously created.
    prometheus.register(GAUGE_EXAMPLE)

  end
end
Then add the following line to your application.rb in order to load the Prometheus module we have just defined:
...
config.autoload_paths << Rails.root.join('lib')
...
Next I've created a controller simply called test_controller.rb that will add some actions to our rails application.
class TestController < ActionController::Base
  include Prometheus::Controller

  # A gauge is a metric that represents a single numerical value that can arbitrarily go up and down.
  def gauge
    GAUGE_EXAMPLE
      .set({route: :gauge}, rand(0..100))
    respond_to do |r|
      r.any do
        render json: {
                 message: "Success",
               }, status: 200
      end
    end
  end

end
Add a route to this action in config/routes.rb
Rails.application.routes.draw do
   get 'test_gauge', to: 'test#gauge'
end
Now issue a request to :3000/test_gauge and you should get a success response indicating that new a value has been assigned to our example gauge we just created.
Heading back over to :3000/metrics we should now be able to see that our gauge metric has appeared with a random value between 1 and 100:

While this is a simple trivial example of what one might do with Prometheus and Rails it provides a good base line for you to go ahead and create some meaningful metrics and achieve an inside view as to how your RoR application is performing.
Need help with Prometheus and its client libraries? Contact us.


No comments.