
Since Prometheus 2.1 there is a feature to view alerting rule evaluation times in the rules UI. In this blogpost we'll see an example of how this can be used to identify an expensive rule expression.
Having run Prometheus 2.1 with the following configuration and alerting rules for a few days to obtain enough data:
prometheus.yml
global:
  scrape_interval: 5s
  evaluation_interval: 5s

scrape_configs:
  - job_name: 'node'
    static_configs:
      - targets:
        - '127.0.0.1:9100'

rule_files:
  - alerting.rules
alerting.rules
groups:
- name: test.rules
  rules:
  - alert: LatencyTooHigh
    expr: job:request_latency_seconds:mean5m{job="promtheus"} > 0.5 and ON(job) job:requests:rate5m{job="prometheus"} > 100
  - alert: ExpensiveAlertingRule
    expr: rate(prometheus_rule_evaluation_duration_seconds_count{job="prometheus", rule_type="recording"}[1d]) > 1
we can head over to the new rules UI and see which rules are taking the longest to evaluate:
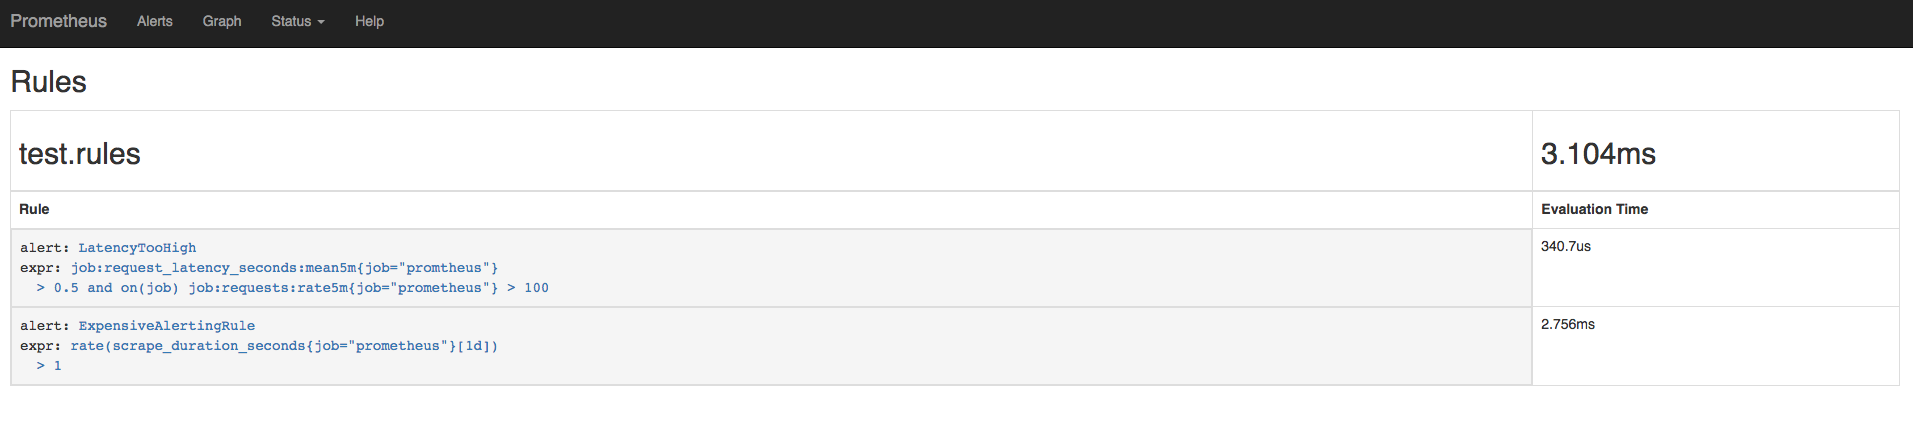
As we can see from the grid above, the problematic alerting rule which is taking a rate over a long period of time of day is rather expensive and taking a lot of time in order to be evaluated (more than x8 times our other rule).
This is useful as we can now pinpoint which of our rules are expensive without having to debug the alerting rules ourselves which may require deeper knowledge of PromQL and the data being queried.
Want to avoid expensive mistakes with Prometheus? Contact us.


No comments.