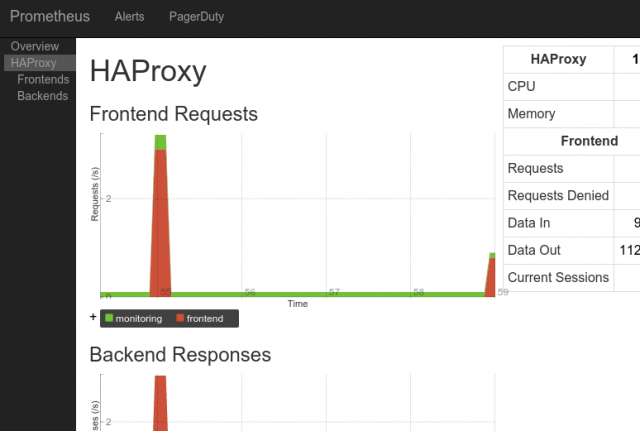
HAProxy is one of many pieces of software that Prometheus provides an integration with. Let's look at how to hook it in and use the built-in console template dashboard.
HAProxy doesn't provide pre-built binaries, so we start by compiling it:
wget http://www.haproxy.org/download/1.6/src/haproxy-1.6.2.tar.gz
tar -xzf haproxy-*.tar.gz
cd haproxy-*
make TARGET=generic
Next we'll configure one a simple setup with a monitoring frontend, and start HAProxy:
cat <<EOF > config
defaults
  mode http
  timeout server 5s
  timeout connect 5s
  timeout client 5s

frontend frontend
  bind *:1234
  use_backend backend

backend backend
  # Use the node_exporter (if any).
  server node_exporter 127.0.0.1:9100

frontend monitoring
  bind *:1235
  no log
  stats uri /
  stats enable
EOF
./haproxy -f config &
If you visit :1235/;csv you'll see CSV monitoring output. This is what the Haproxy Exporter uses.
Now that that's working, we can setup the Haproxy Exporter and Prometheus server:
wget https://github.com/prometheus/haproxy_exporter/releases/download/v0.8.0/haproxy_exporter-0.8.0.linux-amd64.tar.gz
tar -xzf haproxy_exporter-0.8.0.linux-amd64.tar.gz
cd haproxy_exporter-*
./haproxy_exporter --haproxy.scrape-uri ':1235/;csv' &

wget https://github.com/prometheus/prometheus/releases/download/v2.0.0/prometheus-2.0.0.linux-amd64.tar.gz
tar -xzf prometheus-2.0.0.linux-amd64.tar.gz
cd prometheus-*
cat <<'EOF' > prometheus.yml
global:
 scrape_interval: 10s
 evaluation_interval: 10s
scrape_configs:
 - job_name: 'haproxy'
   static_configs:
    - targets:
      - localhost:9101
EOF
./prometheus &
If you visit :9101/metrics you'll see the Prometheus version of the CSV metrics. Wait a bit for some data to be collected, then visit :9090/consoles/haproxy.html for the dashboard!


No comments.