
The node exporter exposes filesystem metrics out of the box, so let's take a look.
The usual way to look at filesystem space usage is df:
$ df
Filesystem     1K-blocks      Used Available Use% Mounted on
udev            16406128         0  16406128   0% /dev
tmpfs            3289028      3280   3285748   1% /run
/dev/md0        32881520  21934588   9253652  71% /
tmpfs           16445128    624400  15820728   4% /dev/shm
tmpfs               5120         4      5116   1% /run/lock
tmpfs           16445128         0  16445128   0% /sys/fs/cgroup
tmpfs            3289024        28   3288996   1% /run/user/1000
The matching metrics from the node exporter for 1K-blocks is node_filesystem_size_bytes. The node exporter uses base units, so node_filesystem_size_bytes / 1024 should produce the same value (or going the other way, use df -B1). Available is node_filesystem_avail_bytes, which is how many bytes are free for use by normal users.
You might note that 32881520 - 21934588 - 9253652 = 1693280 so there's some missing space on the root filesystem. These are reserved blocks (tune2fs /dev/md0 would show them for this ext4 filesystem) for the root user. node_filesystem_free_bytes represents the free space ignoring the reserved blocks. Thus Used would be node_filesystem_size_bytes - node_filesystem_free_bytes, however in practice you almost always want to use node_filesystem_avail_bytes rather than node_filesystem_free_bytes. For for Use% you want 100 - (node_filesystem_avail_bytes/node_filesystem_size_bytes * 100). How best to alert on this has been discussed previously.
Space is only one resource to manage, Unix filesystems are also usually limited in terms of inodes - basically the number of files there are. You can view these with df -i. Similarly the relevant metrics are node_filesystem_files for the total number of permitted inodes and node_filesystem_files_free for how many more you can have.
There's two other metrics. node_filesystem_readonly indicates if the filesystem is readonly, and node_filesystem_device_error indicates if there was a problem getting information for the filesystem via statfs. This is usually due to permissions issues.
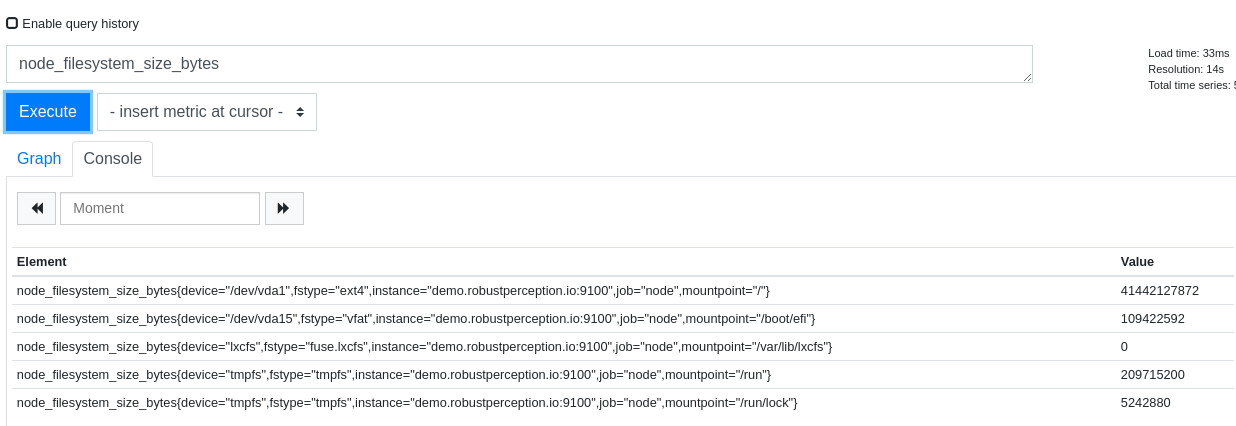
If you look at the metrics themselves, you'll note there's device, fstype, and mountpoint labels:
This is as it is plausible that users will want to restrict alerts/graphs based on each of these aspects depending on the details of their deployment, so a separate _info metric doesn't make sense in this particular case. This has the disadvantage that you must remember to aggregate away the labels you don't want.
Rather than limiting in PromQL, the node exporter can also ignore filesystems per the --collector.filesystem.ignored-fs-types and --collector.filesystem.ignored-mount-pointsflags. The defaults are intended to exclude various pseudo, readonly, and otherwise uninteresting filesystems. For example Docker can produce a lot of churn if there's a crashloop and the filesystems themselves should already already covered, so those paths are ignored out of the box. Occasional updates for new pseudo filesystems are required, note however that tmpfs is explicitly not ignored as you may care if something like /var/run filled up.
Wondering how best to monitor filesystems? Contact us.


No comments.