
Linux provides scheduling metrics in /proc/schedstat, which the node exporter uses.
The node exporter current exposes three of these:
# HELP node_schedstat_running_seconds_total Number of seconds CPU spent running a process.
# TYPE node_schedstat_running_seconds_total counter
node_schedstat_running_seconds_total{cpu="0"} 1.093032217430793e+06
node_schedstat_running_seconds_total{cpu="1"} 1.07527722232456e+06
# HELP node_schedstat_timeslices_total Number of timeslices executed by CPU.
# TYPE node_schedstat_timeslices_total counter
node_schedstat_timeslices_total{cpu="0"} 5.965185464e+09
node_schedstat_timeslices_total{cpu="1"} 5.266658269e+09
# HELP node_schedstat_waiting_seconds_total Number of seconds spent by processing waiting for this CPU.
# TYPE node_schedstat_waiting_seconds_total counter
node_schedstat_waiting_seconds_total{cpu="0"} 217918.365216207
node_schedstat_waiting_seconds_total{cpu="1"} 218559.331226331
node_schedstat_running_seconds_total is how much time was spent doing running processes, and node_schedstat_timeslices_total track the number of slices of time that were used to do so. node_schedstat_waiting_seconds_total is how long processes had to be wait to be scheduled on that CPU.
node_schedstat_waiting_seconds_total can be used to spot not only if you have more processes to be run than CPU time available to handle them, but also indicate how many such processes there on average. The latter is not something which you could figure out from node_cpu_seconds_total alone. For example if I run two competing copies of taskset 1 cat /dev/urandom > /dev/null for a minute to put load on CPU 0 (the first argument to taskset is a bitmask), then you can see the jump in the rate from a few milliseconds of overhead per second to around one second per second:
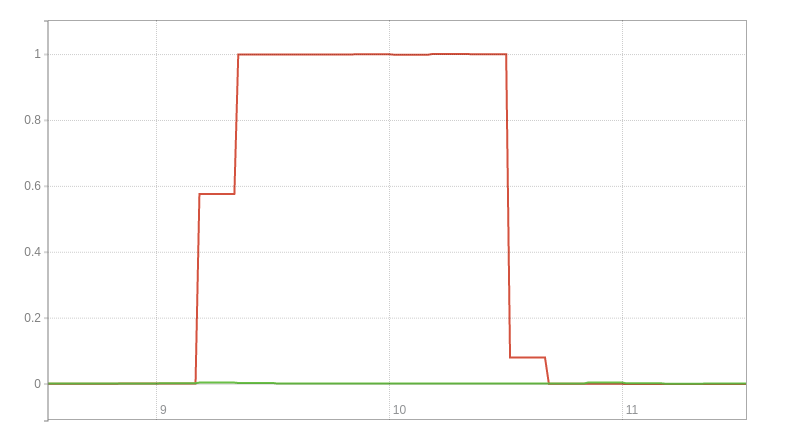
This as one of the two copies is now always waiting to be scheduled on core 0.
This could be useful for debugging performance, but is not something to alert on as it is cause rather than a symptom. Your existing alerts on end-user application latency should already cover this, and more.
Need help monitoring hardware? Contact us.


No comments.