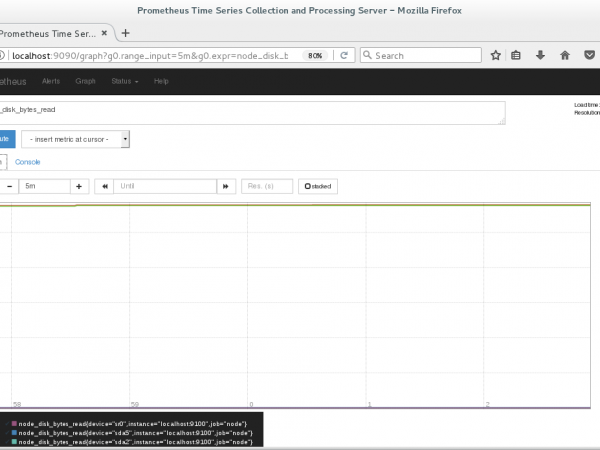
CPU, RAM, disk and network usage are basic machine metrics you should be monitoring. This is easy with Prometheus and the later releases of Debian.
The node exporter is the agent for machine monitoring for Prometheus. If you're on a Debian-based system such as Ubuntu, debs are available from the default official Debian repositories.
You can install the packages by running the following:
sudo apt-get update
sudo apt-get install prometheus
This will spin up a Prometheus and node_exporter instance running on port 9090 and 9100 respectively. The Prometheus instance will be configured to scrape the machine level metrics exported by the node_exporter by default. You can view this configuration at /etc/prometheus/prometheus.yml.
Wait a minute or two for metrics to be collected, and then visit :9090/graph to see how your machine is doing.
If you've more machines, install the node exporter on each of them, add the machines to /etc/prometheus/prometheus.yml and finally run service restart prometheus.


No comments.